- Related AI/ML Methods: Multivariate Discriminant Analysis (Quadratic), Segmentation Clustering
- Related Traditional Methods: Quadratic Discriminant Analysis
The AI Machine Learning Gaussian Mix with K-Means Segmentation model assumes multiple overlaying normal distributions. This is an unsupervised machine learning method that is applicable when we do not know where the clusters come from initially. Typically, the dataset has ![]() rows of data with
rows of data with ![]() columns of multidimensional-space characteristics, and where we typically have
columns of multidimensional-space characteristics, and where we typically have ![]() . The results show the probabilities of a certain value belonging to a particular cluster. When there is a single cluster, we would typically perform a distributional fitting routine such as a Kolmogorov–Smirnov model, but when there are multiple such k normal distribution clusters (with
. The results show the probabilities of a certain value belonging to a particular cluster. When there is a single cluster, we would typically perform a distributional fitting routine such as a Kolmogorov–Smirnov model, but when there are multiple such k normal distribution clusters (with ![]() mean and covariance), the total probability density is a linear function of the densities across all these clusters, where
mean and covariance), the total probability density is a linear function of the densities across all these clusters, where ![]() and
and ![]() is the mix-coefficient for the k-th distribution. An expectations maximization algorithm is used to estimate the maximum likelihood function of the fit, while the Bayes Information Criterion is used to automatically select the best covariance parameters.
is the mix-coefficient for the k-th distribution. An expectations maximization algorithm is used to estimate the maximum likelihood function of the fit, while the Bayes Information Criterion is used to automatically select the best covariance parameters.
A Gaussian Mix is related to the K-Means approach and is fairly simple and uses some Naïve Bayes and likelihood estimations. Sometimes the results are not as reliable as, say, a supervised Support Vector Machine (SVM) method. This is because of the Gaussian Mix’s unsupervised algorithm, which may not converge. Run the same model several times to see if the model converges (i.e., the results will be the same each time when you click Run). If the results are not identical, try increasing the number of iterations and test again. If the results obtained are not as expected, reduce the number of variables, and increase the number of rows and try again with a higher iteration. The best model is the one with the maximum log-likelihood value (be careful here as log-likelihood is typically a negative value, which means a model with –100 is better than a model with a –300 log-likelihood measure). Alternatively, try the unsupervised AI/ML Segmentation Clustering methodology, which is typically more reliable. Whenever possible and if the data allow for it, the recommendation is to use the supervised SVM methods or the unsupervised AI/ML Segmentation Clustering method.
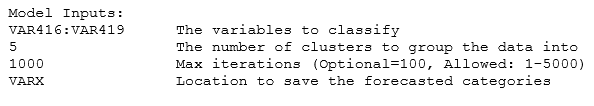
Figure 9.59 illustrates a dataset of 50 states and their reported 10-year averages of criminal activities, including the number of murders, aggravated assaults, and breaking and entering events, as well as the population (in millions). Suppose we want to, without any supervision, categorize the states into 5 clusters. Simply enter the variables you need to classify and enter the number of clusters desired. For instance, the required model inputs look like the following:
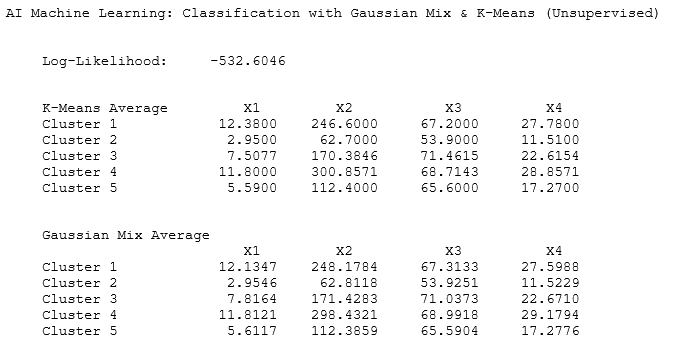
The results will show both the K-Means Clustering as well as the Gaussian Mix models. As mentioned, if the same model is re-run several times and the results remain the same, the model has converged; otherwise, add more iterations and try again. If the model converges, use the results from that run. If convergence is not achieved, either apply a different method completely or re-run the same model several times and select the one with the maximum log-likelihood value. Also, when the cluster means of K-Means and Gaussian Mix are close to each other, the results are relatively reliable. These means usually do not equal each other as they run different algorithms.
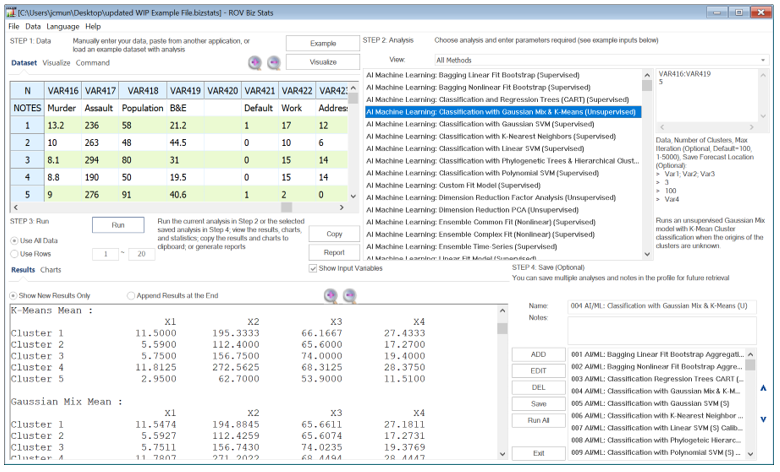
Figure 9.59: AI/ML Classification with Gaussian Mix
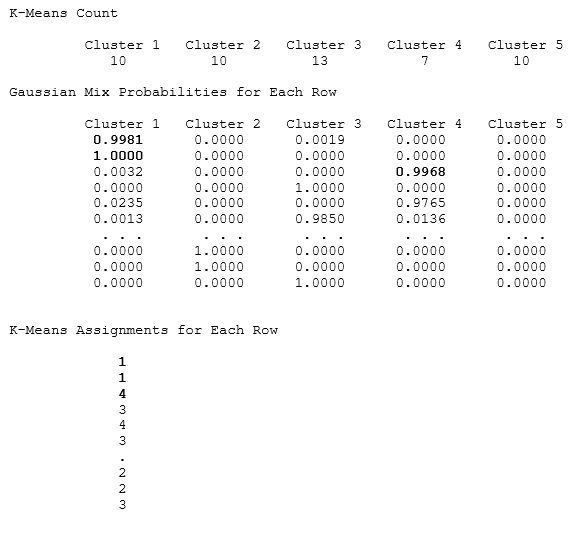
As shown in Figure 9.59, the K-Means and Gaussian Mix cluster means are provided for the requested 5 clusters (shown as rows in the results) for each of the 4 independent variables (shown as columns). Then, the K-Means counts of the number of states in each category are provided, as are the K-Means assignments of these states into the various categories. The Gaussian Mix results also provide the probabilities that a certain state falls within a specific category. For instance, we see from the results that there are 10 rows grouped into Cluster 1, 10 into Cluster 2, and so forth. The Gaussian Mix probabilities show that there is a 99.81% chance the first row’s data fall into Cluster 1, the second row’s data has a 100% chance of being in Cluster 1, the third row’s data has a 99.68% chance of being in Cluster 4, and so forth You can also run the analysis using AI/ML Cluster Segmentation but be aware that similar rows will be clustered together although the numbering of the clusters may differ due to the different algorithms used. For example, Cluster 1 may be called Cluster 5, and so on.