The most straightforward way to present ALM structures for liquidity and interest-rate risk management is through the utilization of Gap charts. A Gap chart is simply the listing of all assets and liabilities as affected by interest rate movements or liquidity movements, respectively, ordered on time-defined buckets (i.e., days, weeks, months, or years). Typically, for interest-rate risk, there are two main management approaches: a shorter-term structure analysis based on a more accounting-side perspective, usually referred to as the NIM (Net Interest Margin) approach, and a longer-term structure analysis based on a more economic-side perspective, usually referred to as the EVE (Economic Value of Equity) approach. The NIM approach rests on the logic that the natural mismatch between assets and liabilities has an impact on earnings, through the net interest margin, and such impact can be measured through given deltas (variations) in the referential market interest rate. In this case, the impact is measured through the Gap chart, as applied to balance sheet items of the asset and liability sides, respectively. So, on the one hand, a natural NIM approach would deliver a balance sheet impact on earnings, based on the structure and maturity of assets and liabilities, when subjected to a 100-basis point increase in the referential market interest-rate risk. Because the Gap analysis defines which side of the balance sheet (assets or liabilities) the cash flow is on, as well as accounting for each time bucket, analysts can define which sign would apply to earnings should interest rates go up or down. Therefore, the combination of these two tools allows for the establishment of different business and stress scenarios and, hence, the determination of targets and limits on the structure and duration of assets and liabilities. The EVE approach, on the other hand, is a long-term evaluation tool, by which analysts can determine the impact on capital (or equity, defined as assets minus liabilities) of referential market interest-rate valuations, as it affects the net present value and duration of the described balance sheet items. By this approach, the system can calculate the deltas in durations and in net present value of assets, liabilities, and equity, as measured in the Gap charts. Therefore, such variations allow for the construction of scenarios for the different impacts on equity value and duration of changes in the referential market interest rate. These results are then fed into different KRIs for monitoring, defining, and calibrating targets and limits in line with the IMMM risk management structure.
Figure 1.7 illustrates the Gap Analysis results of Interest Rate Risk. The results are shown in different grids for each local and foreign currency. Gap Analysis is, of course, one of the most common ways of measuring liquidity position and represents the foundation for scenario analysis and stress testing, which will be executed in subsequent tabs. The Gap Analysis results are from user inputs in the input assumptions tab. The results are presented for the user again for validation and in a more user-friendly tabular format. The Economic Value of Equity results are based on interest-rate risk computations in previous tabs. The impacts on regulatory capital as denoted by VaR levels on local and foreign currencies are computed, as are the duration gaps and basis point scenarios affecting the cash flows of local and foreign currencies.
Figure 1.8 illustrates the Net Income Margin (NIM) Input Assumptions requirements based on interest-rate risk analysis. The highlighted cells in the data grid represent user input requirements for computing the NIM model. The Economic Value of Equity and Gap Analysis calculations previously described are for longer-term interest-rate risk analysis, whereas the NIM approach is for shorter-term (typically 12 months) analysis of liquidity and interest-rate risk effects on assets and liabilities. In the gap analysis and stress testing analysis, we proceed using:
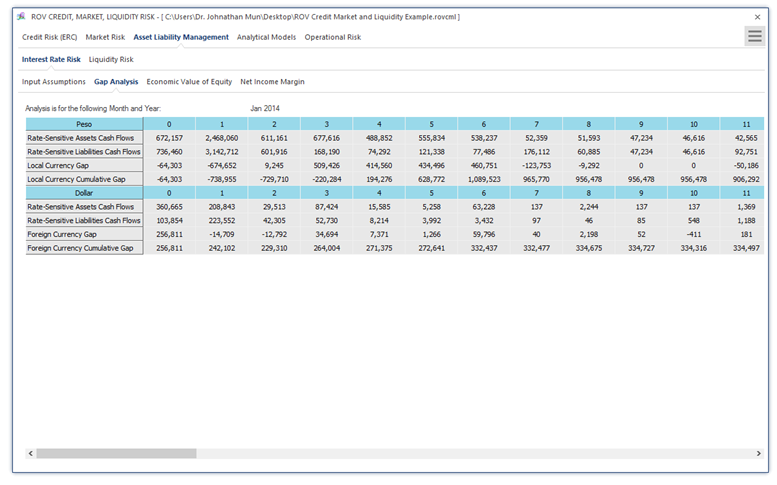
Figure 1.7: Asset Liability Management—Interest-Rate Risk: Gap Analysis
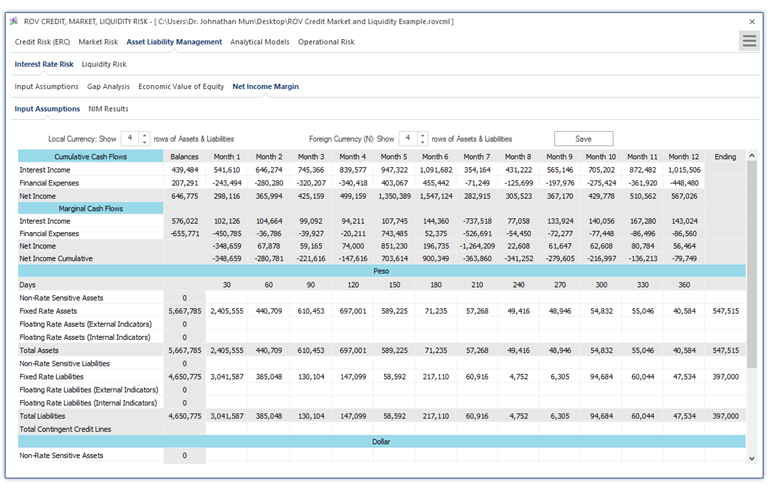
Figure 1.8: Net Income Margin (NIM): Input Assumptions and Model
In NIM calculations, we use: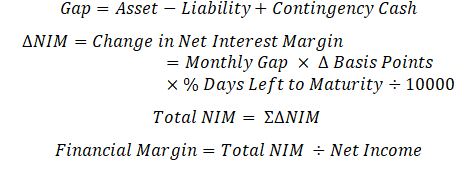
Figure 1.9 illustrates the PEAT utility’s ALM-CMOL module for Asset Liability Management—Liquidity Risk Input Assumptions tab on the historical monthly balances of interest-rate sensitive assets and liabilities. The typical time horizon is monthly for one year (12 months) where the various assets such as liquid assets (e.g., cash), bonds, and loans are listed, as well as other asset receivables. On the liabilities side, regular short-term deposits and timed deposits are listed, separated by private versus public sectors, as well as other payable liabilities (e.g., interest payments and operations). Adjustments can also be made to account for rounding issues and accounting issues that may affect the asset and liability levels (e.g., contingency cash levels, overnight deposits, etc.). The data grid can be set up with some basic inputs as well as the number of subsegments or rows for each category. As usual, the inputs, settings, and results can be saved for future retrieval.
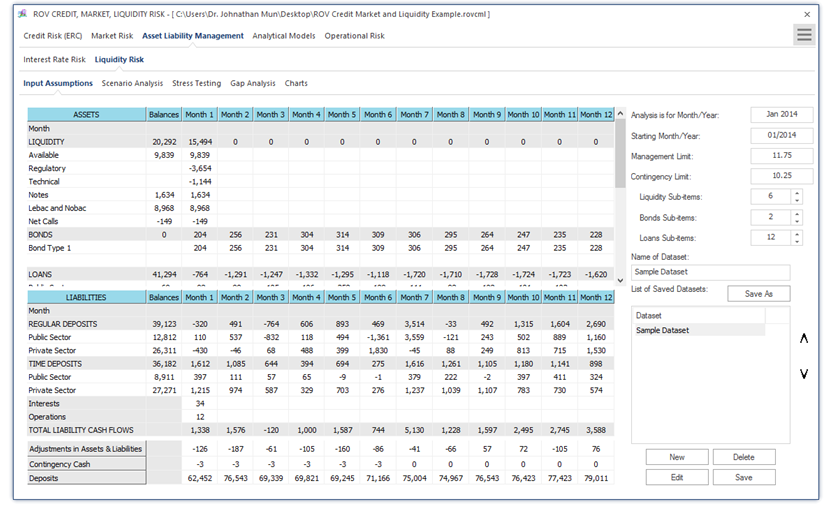
Figure 1.9: Asset Liability Management—Liquidity Risk Model and Assumptions