Traditional schedule management typically starts with a list of tasks. Next, these tasks are put in order and linked from the predecessor to successor for each task. They are typically displayed in either a Gantt chart form or a network. For our discussion in this chapter, we concentrate on the network diagram. The duration for each task within the network is then developed. The estimated duration for each task is given a single-point estimate, even though we know from experience that this estimate should be a range of values. Therefore, the first mistake is using a single-point estimate. In addition, many people who provide duration estimates try to put their best foot forward and give an optimistic or best-case estimate. If we assume that the probability of achieving this best-case estimate for one task is 20%, then the likelihood of achieving the best case for two tasks is merely 4% (20% of 20%), and three tasks yield only 0.8%. Within a real project with many more tasks, there is only an infinitesimal chance of making the best-case schedule.
Once the task duration estimates have been developed, the network is constructed and the various paths through the network are traced. The task durations are summed along each of these paths, and the one that takes the longest is identified as the critical path.
Figure 1.1 illustrates an example network and critical path. The sum of task durations along the critical path is listed as the project completion date. In Figure 1.1, there are four paths through the network from beginning to end. The shortest/quickest path is Tasks 1-2-3-10-11 with a total duration of 22 days. The next shortest path is tasks 1-7-8-9-10-11 at 34 days, and then path 1-4-5-6-10-11 at 36 days. Finally, the path 1-4-8-9-10-11 takes the longest at 37 days and is the critical path for this network.
So let us assume that this network of tasks is our part of a larger effort and some other effort upstream of ours has overrun by a day. Our boss has asked us to shorten our schedule by one or two days to get the overall effort back on track. Traditional schedule management has one target: shorten the longest duration item in the critical path. Another approach is to shorten every task on the entire critical path. Because the first technique is more focused, more prone to success, and creates fewer conflicts on our team, let us assume that we will use that one. Hence, we will want to reduce Task 8 from 10 days to 9 days to shorten our schedule and we will satisfy our boss or our customer. Let us leave the traditional methodology at this stage feeling satisfied with our efforts, but curious about exploring alternatives. The next step is to explore simulation and risk analytics to enhance the management of the project. Specifically, we will be employing Monte Carlo risk simulations on each of the task’s projected budget and schedule, resulting in a probabilistic and risk profile view of the entire network’s cost and schedule.
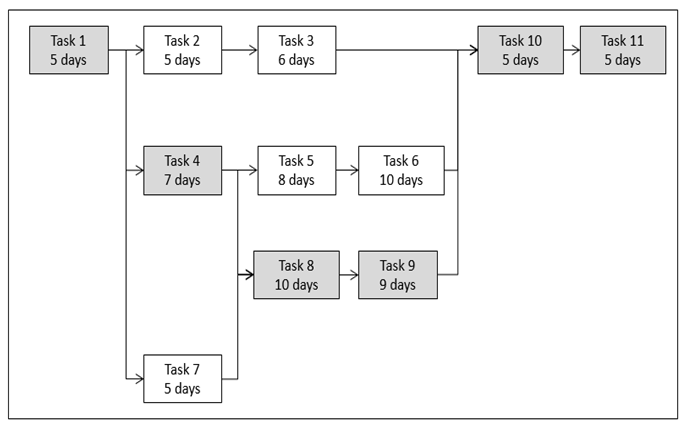
Figure 1.1: Network Schedule