Cost overruns and probabilities of success on each connected task can be included in the complex path model calculations. These inclusions will only affect a project’s cost and not its schedule.
Figure 6.1 illustrates a basic sequential path model without any overrun assumptions or probabilities of success, while Figure 6.2 shows the same model with some overrun assumptions on the budget. Figure 6.3 uses probabilities of success on each task but without any budget overrun. Finally, Figure 6.4 shows the same model with both budget overruns and probabilities of success on each task. An identical simulation of 10,000 trials was run with a seed value of 123. This way, we can have a proper and direct comparison of these four models and see the effects of these overrun assumptions and probabilities of success on the schedule and cost risk profile.
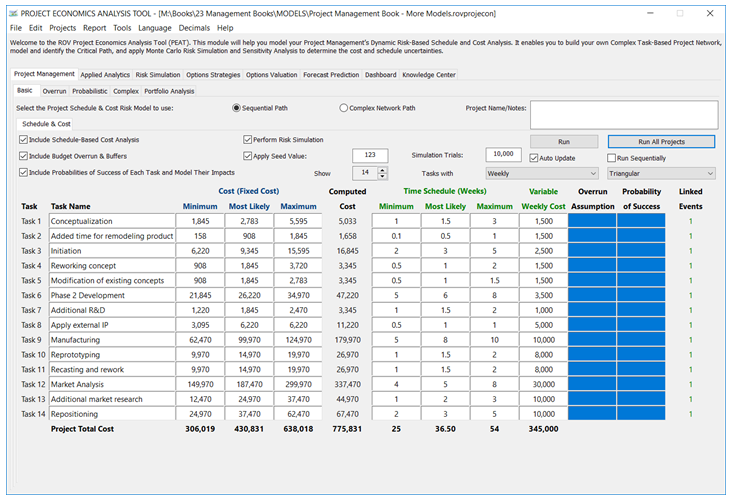
Figure 6.1: Basic Model without Budget Overrun and Probability of Success
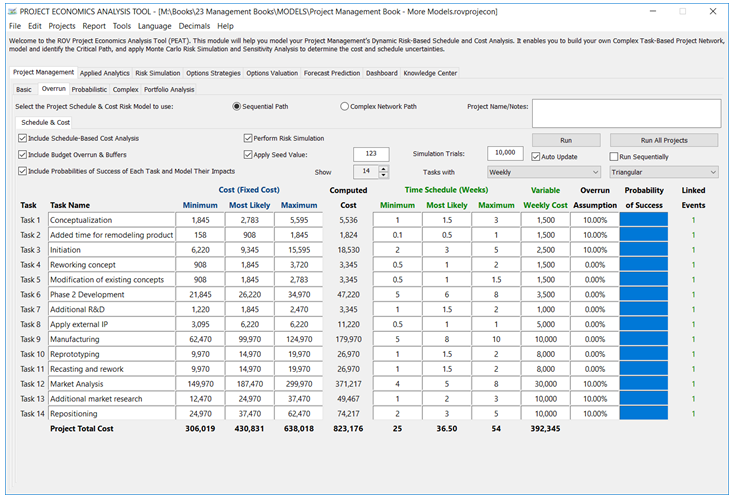
Figure 6.2: Budget Overrun
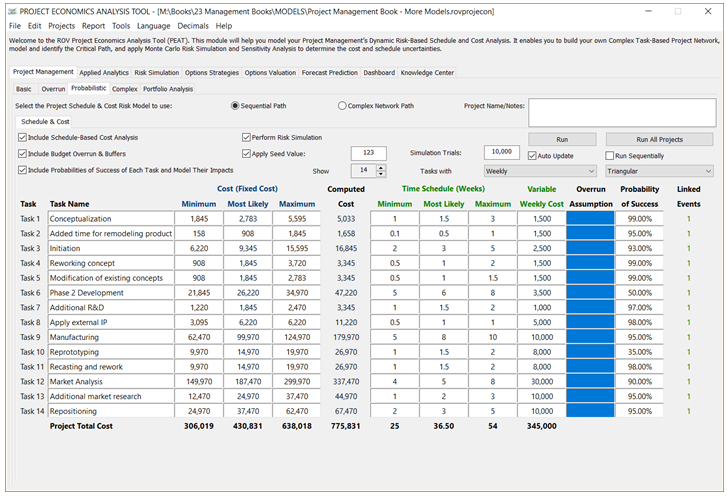
Figure 6.3: Probability of Success
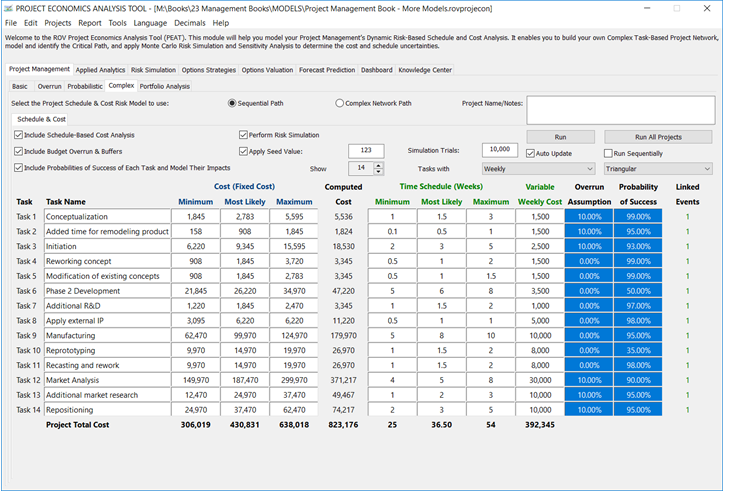
Figure 6.4: Budget Overrun and Probability of Success
Figures 6.5, 6.6, and 6.7 show the results comparison for the four models described previously. Below are several key observations:
- Project Schedule is unchanged in all four models. Specifically, the expected project schedules are all identical (36.5 weeks). Further, the simulated probabilities on schedules are statistically identical (simulated average project schedule and the 90% percentile schedule) and are only subjected to minor rounding differences (38.2 weeks and 40.6 weeks, respectively) caused by the random number generator of the simulation process.
- Single-point estimate values of expected project costs for the basic model and task probabilities model are identical ($775,831) because the probability is only applied when simulation is applied. Hence, single-point estimates would reveal identical values. Further, the budget overrun model and complex model with probabilities and overrun will yield identical expected project costs ($823,176) as they both include a budget overrun, which would, of course, generate higher costs than the basic model ($775,831).
- The simulated average project costs for probabilistic tasks and budget overrun (complex project) show a significantly reduced value ($191,705 and $198,606, respectively). This is because when a task fails, all subsequent tasks’ costs are not incurred, and the project terminates. So, with a probabilistic task model, there is a chance the project will terminate at various points and the simulated average costs will show that. However, a 90th percentile of the costs will still yield a higher value but not as high as the models with non probabilistic tasks.
- Finally, Figure 6.7 shows that the costs are trimodal, with three potential stages of completion of the project. Figure 6.4’s low probabilistic inputs (50%, 35%) delineate the tasks into three groups (Tasks 1–5, 6–9, and 10–14).
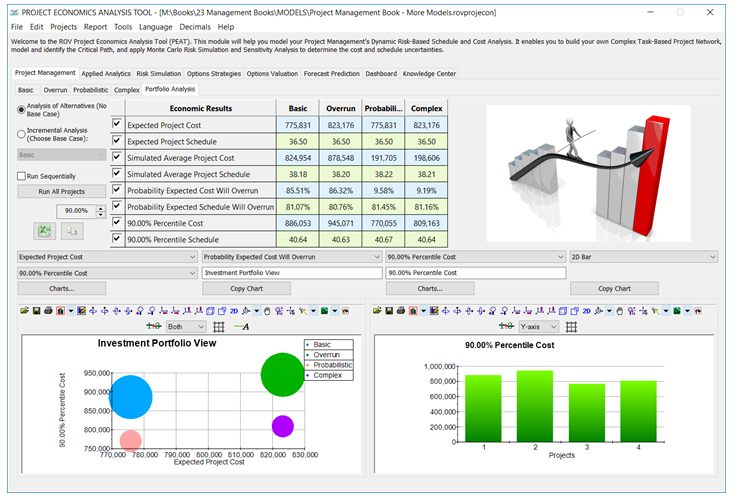
Figure 6.5: Comparative Analysis
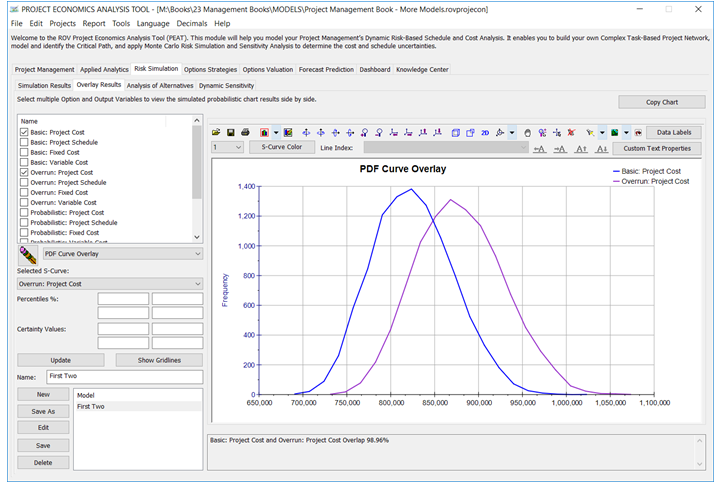
Figure 6.6: Overlay of Basic and Overrun Models
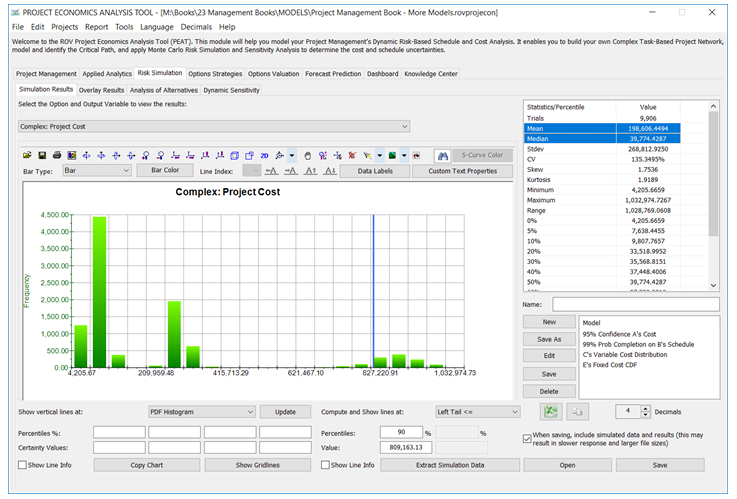
Figure 6.7: Trimodal Simulated Cost Structure
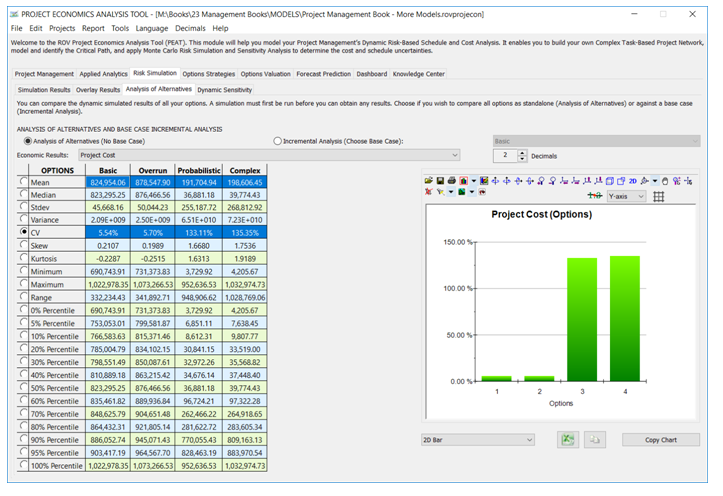
Figure 6.8: Expected Cost and Project Volatility