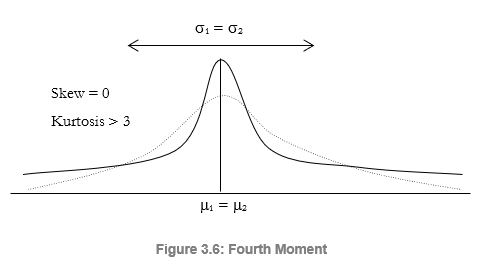
The fourth moment, or kurtosis, measures the peakedness of a distribution. Figure 3.6 illustrates this effect. The background is a normal distribution with a kurtosis of 3.0. The new distribution has a higher kurtosis, thus the area under the curve is thicker at the tails with less area in the central body. This condition has major impacts on risk analysis because for the two distributions in Figure 3.6, the first three moments (mean, standard deviation, and skewness) can be identical but the fourth moment (kurtosis) is different. This means that although the returns and risks are identical, the probabilities of extreme and catastrophic events (potential large losses or large gains) occurring are higher for a high kurtosis distribution (e.g., stock market returns are leptokurtic or have high kurtosis). Ignoring a project’s return’s kurtosis may be detrimental. Fortunately, the calculations for these four moments are automatically done for you using the Risk Simulator software as will be seen in later chapters.
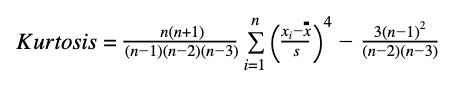
Most distributions can be defined up to four moments. The first moment describes its location or central tendency (expected returns); the second moment describes its width or spread (risks); the third moment, its directional skew (most probable events); and the fourth moment, its peakedness or thickness in the tails (catastrophic losses or gains). All four moments should be calculated and interpreted to provide a more comprehensive view of the project under analysis. Finally, the term moment refers to the highest power of x in each of the statistics’ equations.