In Figure 3.2, the sample schedule inputs in days are shown. In order to illustrate the step-by-step computations, we will use an Excel worksheet grid.
The first subtotal sums the durations for Tasks 1 through 4 (Tasks 1–4). The next subtotal is the maximum duration of the paths Tasks 5&6, Task 5&7, and Tasks 8–11. The third subtotal is the duration of Task 12. The fourth subtotal is the maximum duration of Task 13, Tasks 14-16, and Task 17. The last subtotal sums the duration for the remaining tasks (Tasks 18–24). The sum of the subtotals is the forecast for the complete schedule. When you run the model, you will get a forecast for the entire range of possible durations for the entire project.
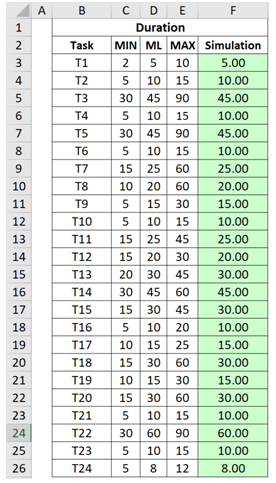
Figure 3.2: Sample Schedule Inputs
Subtotal 1 = 70.00
-
- SUM(F3:F6) or 5 + 10 + 45 + 10 = 70
- Sum of duration for Tasks 1–4
Subtotal 2 = 70.00
-
- MAX(SUM(F7:F8),SUM(F7,F9),SUM(F10:F13))
or MAX(45+10, 45+25, 20+15+10+25) = 70
-
- Maximum of (Tasks 5 & 6, Tasks 5 & 7, Tasks 8–11)
Subtotal 3 = 20.00
-
- F14 or 20
- Duration of Task 12
Subtotal 4 = 85.00
-
- MAX(F15,SUM(F16:F18),F19) or
MAX(30, 45 + 30 + 10, 15) = 85
-
- Maximum of (Task 13, Task 14–16, Task 17)
Subtotal 5 = 163.00
-
- SUM(F20:F26)
or 30 + 15 + 30 + 10 + 60 + 10 + 8 = 163
-
- Sum of duration of Tasks 18–24
TOTAL = 408.00
-
- 70 + 70 + 20 + 85 + 163 = 408
- Output Forecast schedule for entire network