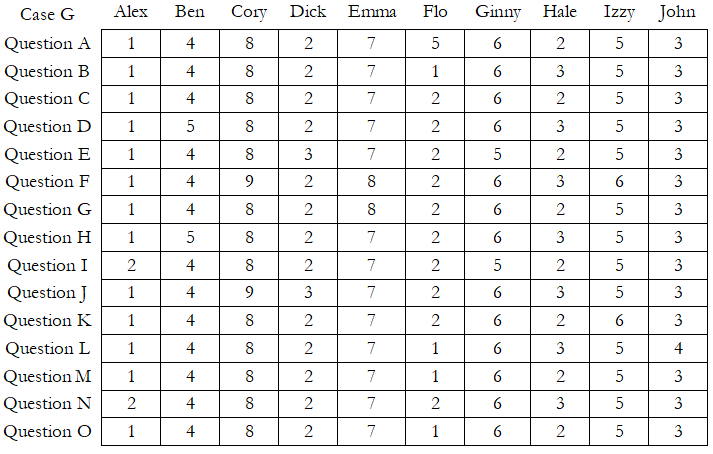
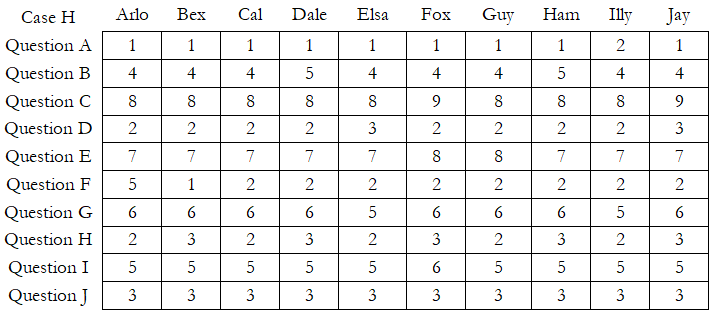
When the responses are not binary but categorical, we can use the Guttman’s Lambda test for inter-rater consistency and reliability. A quick scan of Case G in the following table indicates a familiar problem, where the vertical entries are almost identical in each column, but the columns themselves are not consistent across the different raters. For instance, Alex might always select a low score regardless of the question or issue posed, whereas Cory is an optimist and consistently provides a high score. The raters themselves might be consistent with themselves, but they are certainly not consistent with other raters. The computed Guttman’s Lambda = 0.07563, with a corresponding Spearman–Brown Correlation Correction Factor = 0.07782 using BizStats (note that if multiple correlation correction factors are presented, we usually look at the more conservative measure). Low correlation corrections and low lambda scores mean there is low reliability and low consistency among the raters. Note that the data matrix is inverted in this test, as opposed to the Cronbach’s test, where we show the questions as rows and respondents or judges/raters as columns. In comparison, for Case H, Guttman’s Lambda = 0.99004 and the conservative Spearman–Brown Correlation Correction Factor = 0.9909. This indicates a very high consistency and reliability of the responses. For instance, Question A received a very low score regardless of the rater, whereas Question C scores high consistently. Looking across the rows shows consistency and reliability in the data.