- Related AI/ML Methods: Multivariate Discriminant Analysis (Linear and Quadratic)
- Related Traditional Methods: Discriminant Analysis (Linear and Quadratic)
Taking the original dataset, we run some internal algorithms (a combination of k-means hierarchical clustering and other methods-of-moments to find the best-fitting groups or natural statistical clusters) to statistically divide or segment the original dataset into multiple groups. Segment this dataset into as many groups as you wish. This technique is valuable in a variety of settings including marketing (market segmentation of customers into various customer relationship management groups etc.), physical sciences, engineering, and others.
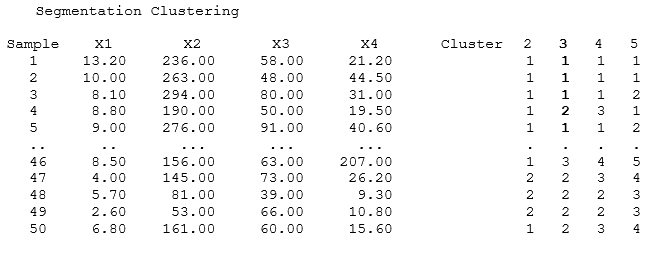
Figure 9.81 illustrates the AI Machine Learning Segmentation Clustering algorithm at work. VAR415 shows the various states, whereas VAR416:VAR419 provides the characteristics in terms of each state’s number of murders, number of assaults, the state population in millions, and number of breaking-and-entering events. Using these numerical values (VAR416:VAR419), the states can be segmented into various groups.
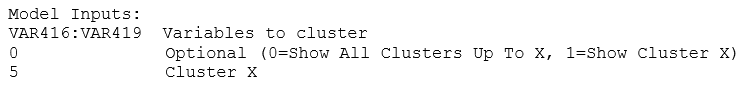
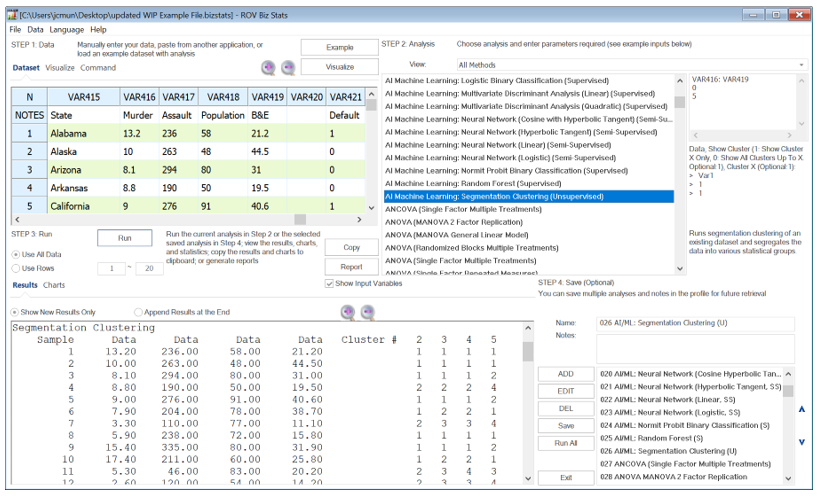
Figure 9.81: AI/ML Segmentation Clustering (Unsupervised)
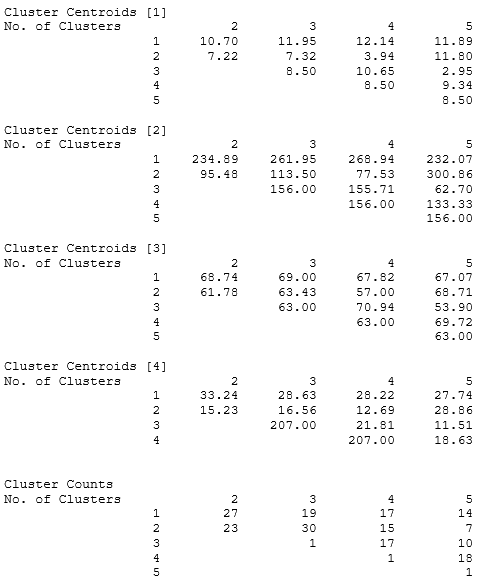
The results from cluster analysis shown next generate clusters of multiple groups partitioned based on data similarity for exploratory data analysis and data mining (e.g., machine learning, pattern recognition, image analysis, bioinformatics, etc.). The objects in the same cluster are more similar to each other than to those in other clusters. In addition, cluster analysis can be used to discover data structures without providing an explanation or interpretation of the relationship among variables. The results will show the cluster membership number as well as the centroid’s mean values and counts of members within each cluster subgroup. For example, if we need to segregate the data into 3 segments, we see that one segment has Alaska, Alabama, Arizona, and so forth, while the second segment includes states like Arkansas and so forth (i.e., the 3 Cluster result shows 1, 1, 1, 2, 1, and so forth, indicating that the first three sample rows are categorized into Cluster 1, followed by Cluster 2, and then Cluster 1, etc.). These segments group similar characteristics together as cohorts, where states within these cohorts have the highest amounts of statistical similarities.