File Name: Simulation – Correlated Simulation
Location: Modeling Toolkit | Risk Simulator | Correlated Simulation
Brief Description: Illustrates how to use Risk Simulator for running a simulation with correlated variables, as well as extracting data and determining the final correlations
Requirements: Modeling Toolkit, Risk Simulator
This model illustrates how to set up basic correlated variables in a Monte Carlo simulation, extract the data, and confirm that the resulting correlations closely match the input correlations in the model.
Correlated Model
Simply open the existing profile, run the simulation, extract the data, and compute a correlation matrix. The results for 5,000 trials are provided in this example. Note that the input pairwise correlations were all 0.50, and the resulting correlations computed from the data are very close to the required input correlations. Figure 134.1 illustrates the sample correlated model. Figure 134.2 shows the simulated results that have been extracted. A correlation analysis was run on the results using Excel, and the results indicate that the empirical simulated data match the correlations required and entered in the model. Therefore, this model is used to illustrate how correlations can be inputted in a simulation model. The next chapter shows the effects of correlations on a model, specifically on the risk and return profile of the model.
For the sake of completion, Figure 134.3 shows how pairwise correlations can be set in Risk Simulator. Simply select any of the cells with predefined assumption and click on Risk Simulator | Set Assumption and in the set assumption dialog box, enter in the correlations (see the highlighted section in Figure 134.3). Be aware that entering correlations this way requires manual pairwise inputs. That is, suppose there are three assumptions in the model, A, B, and C. There will be three pairs of correlations: AB, AC, and BC. In order to insert these three pairwise correlations, you will have to select variable A and manually type in the correlations for AB and AC (note that inserting a correlation between A and B within the A variable will automatically update variable B to show this same correlation back to variable A), and then select variable B to correlate it to variable C.
Alternatively, Figure 134.4 shows how all pairwise correlations can be entered in a matrix. This matrix is available after assumptions have been first set, and then going to Risk Simulator | Edit Correlations. You can also select a predefined correlation matrix in Excel and click on the Paste button in the edit correlations dialog to update the matrix.
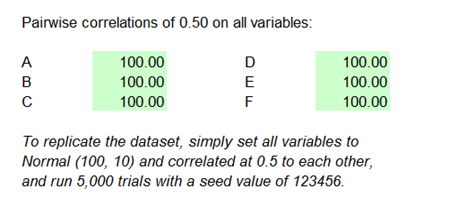
Figure 134.1: Example correlated simulation model
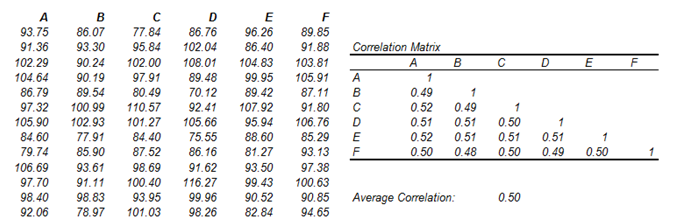
Figure 134.2: Computed empirical correlations
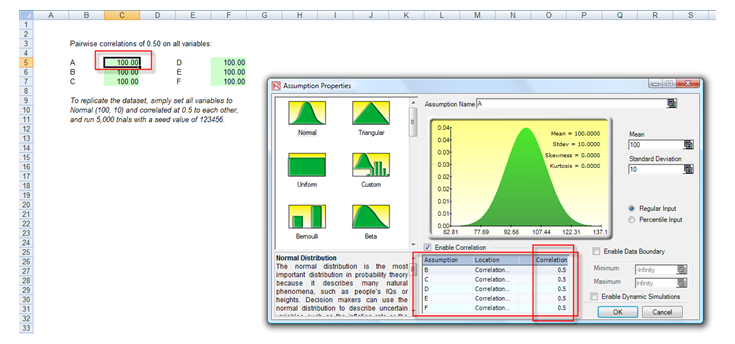
Figure 134.3: Setting pairwise correlations manually
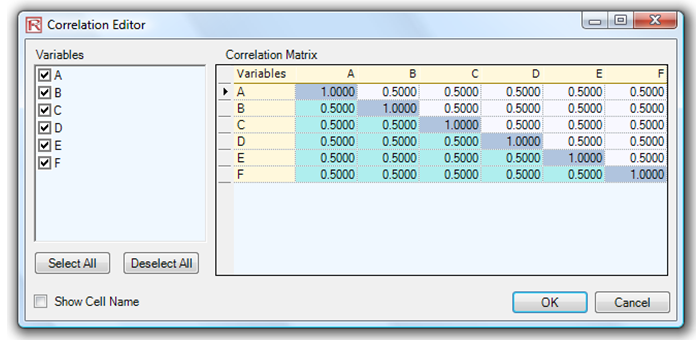
Figure 134.4: Setting pairwise correlations using a matrix