In complex projects where there are nonlinearly bifurcating and recombining paths (Figure 2.5), the cost and schedule risk modeling is more difficult to model and compute. For instance, in the Project A tab of the default example, we can see that after Task 1, future tasks can be run in parallel (Tasks 2, 3, and 4). Then, Tasks 3 and 4 recombine into Task 8. Such complex path models can be created by the user simply by adding tasks and combining them in the visual map as shown, using the relevant icon tools (Figure 2.6). The software will automatically create the analytical financial model when Create Model is clicked. That is, you will be taken to the Schedule & Cost tab and the same setup as shown previously is now available for data entry for this complex model (Figure 2.7). The complex mathematical connections will automatically be created behind the scenes to run the calculations so that the user will only need to perform the very simple tasks of drawing the complex network path connections. Below are some tips on getting started:
- Start by adding a new project if required, from the Projects Then, click on the Complex Network Path radio selection to access the Network Diagram tab.
- Use the icons to assist in drawing your network path. Hover your mouse over the icons to see their descriptions. You can start by clicking on the third icon to Create a New Task, and then click anywhere in the drawing canvas to insert said task.
- With an existing task clicked on and selected, click on the fourth icon to Add a Subtask. This will automatically create the adjoining next task and next task number. You then need to move this newly inserted task to its new position. Continue with this process as required to create your network diagram. You can create multiple subtasks off a single existing task if simultaneous implementations occur. Simply drag the newly created task box to the desired location.
- Double click on any task node to change its properties such as adding a task name or changing its color.
- When the network diagram is complete, click on Create Model to generate the computational algorithms wherein you can then enter the requisite data in the Schedule & Cost tab as described previously.
- The icon taskbar shown in Figure 2.6 will come in handy when creating your own custom complex diagram.
-
- Create New Network Model icon will clear the existing diagram and allow you to start from scratch.
- Edit Existing Model icon is the same as the Edit Model button to the right. It allows you to unlock an existing model to make modifications to it. When done, make sure to click on Save Changes so that the model changes are updated and the algorithmic links between tasks are updated (this will also update the calculations in the Schedule & Cost tab).
- Add a New Task icon will add the first task (Task 1) in the canvas area.
- Add a New Connected Task icon will add a new subsequent task, and the link will depend on which task you have currently selected prior to clicking this icon. Note that this icon will not work unless an existing task node is first selected.
- Link Task and Delete Link icons are used when you want to add or delete links between task nodes. You can recombine different tasks or merge tasks by clicking on one task, then holding down the control (Ctrl) key and clicking on the second task you wish to join, and then clicking on the Link Tasks icon to join then. Similarly, you can click on the sixth icon to Delete Link between any two tasks.
- Insert Text or Note Box icon will insert a text box depending on where you click on the canvas. You can resize the text box and double-click on it to insert your own custom text. These text boxes are helpful as they are used to provide added information to the visual model.
- Undo and Redo icons will simply undo or redo the last command or function.
- Zoom In and Zoom Out icons allow you to change the zoom on the complex diagram you have created for a better visual.
- Change Location of Task Name icon will change the location of where the text of a certain selected task node will appear. This icon will toggle among the four possible text locations around a task node.
- Change Location of Line Link icon will toggle among the possible locations where the incoming connection line can be placed. Sometimes, depending on the model created, this change link location may not provide any additional options other than the single location that currently exists.
- Font Settings icon will pop up the standard font settings for you to choose, but only if the required task node is first selected. Font settings are specific to each task node.
- Change Background Size icon allows you to change the size of the canvas for creating your complex model. The default size is 1361 × 624 pixels.
- Insert Intermediate Node icon allows you to insert a floating task node and number it between the starting task and the last task that currently exists. It will then shift all subsequent task numbers appropriately. For example, if your model has Tasks 1–5 set up, you can now insert an intermediate Task 3, and the existing Tasks 3, 4, and 5 will be renumbered to Tasks 4, 5, and 6. You can now select any two tasks by holding down the Ctrl key and clicking on the fifth icon to link the tasks. Note that you may need to manually delete any incorrect links that may now still exist as you add a new intermediate task. Also, any task links automatically detected as invalid will be deleted.
- Delete Intermediate Node icon allows you to delete any existing intermediate node. Simply select the task node you wish to delete and click on this icon to delete the node.
- Renumber Intermediate Node icon is used to renumber a selected task node. Note that incorrectly linked tasks will now have their links automatically deleted. In addition, by renumbering nodes, you may now need to manually add or delete any links between intermediate nodes as required in your model.
- Auto Renumber All Nodes icon will automatically renumber all task nodes at once after intermediate nodes are added or deleted. This function will renumber the nodes consecutively, avoiding any missing intermediate integer values.
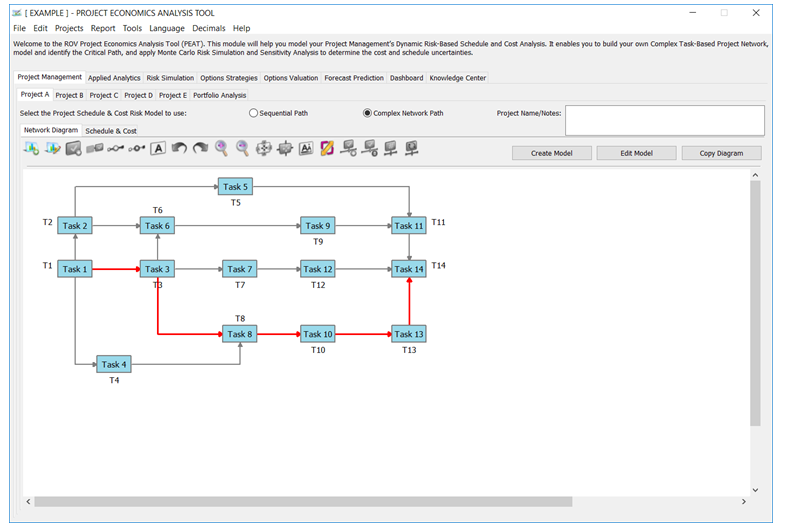
Figure 2.5: Complex Path Project Management
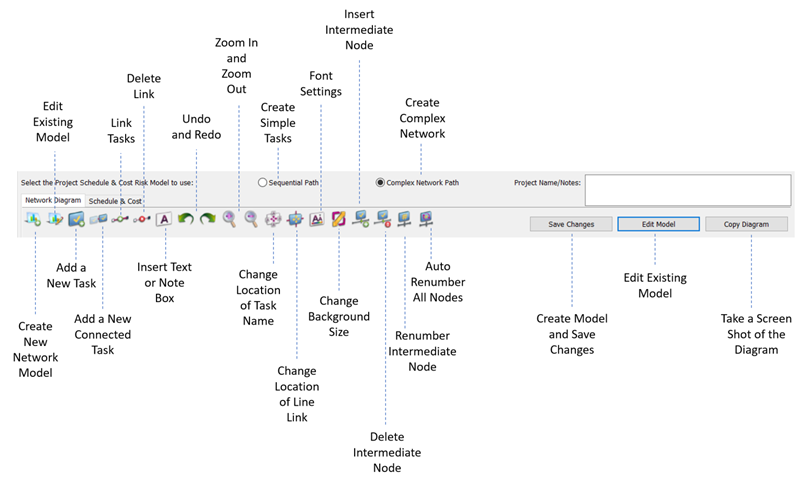 Figure 2.6: Complex Model Icons
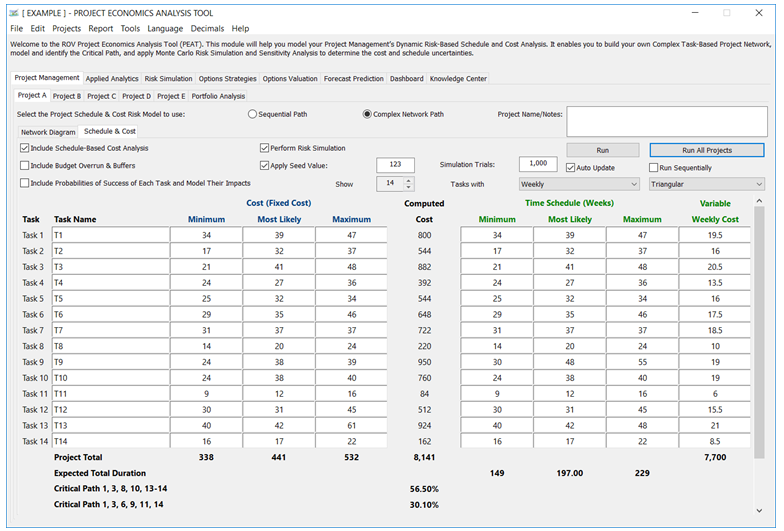
Figure 2.7: Complex Project Simulated Cost and Duration Model with Critical Path