Once the simulation is complete, we can determine the risk profile as usual. For example, Figure 4.2 shows that there is a 90% probability that the project will complete by date 44323.30 or May 7, 2021. The simulated risk profile is shown in Figure 4.3. Note that Risk Simulator will run simulations based on a numerical value and will return its results using the same numerical value. Simply enter this number in an empty cell and right-click the cell or CTRL+1 to open the Format Cells dialog (Figure 4.4) and change the Number formatting to Custom dates. The bottom of Figure 4.1 shows both the numerical value and the date conversion using the format cell approach. All other numerical values can be similarly converted into a calendar date.
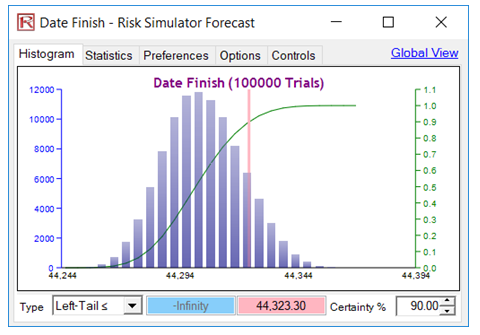
Figure 4.2: Simulated Results – Percentile
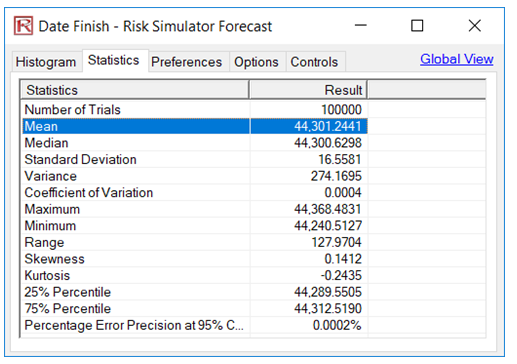
Figure 4.3: Simulated Results – Risk Profile
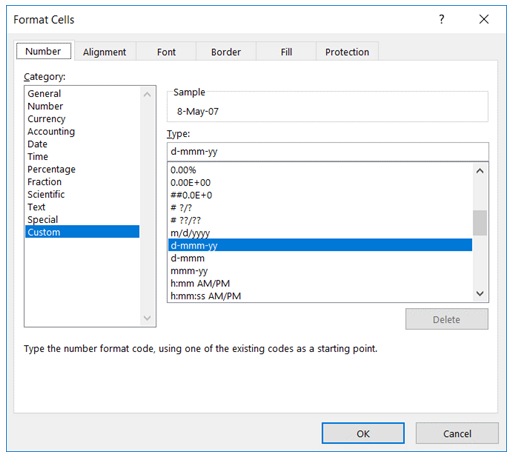
Figure 4.4: Cell Format Settings