Using the complex network path shown in Figure 5.1, we illustrate how the critical path is calculated in Figure 5.2 using an Excel model. The example shows 21 tasks, each with its own optimistic (minimum), expected (likely), and pessimistic (maximum) duration. The earliest finish time is the earliest start time plus the simulated duration, where the earliest start time is the previous task’s earliest finish time. If there are complex loops in a task’s predecessors, then the maximum duration is used. The model is then completed with the calculation of the last start time, last finish time, and the slack between the last start time and the earliest start time. If the slack is zero, meaning there is no extra buffer time, then it is considered to be a task that is on the critical path. Figure 5.3 shows the exact specifications of the calculations, complete with the rows and column headers.
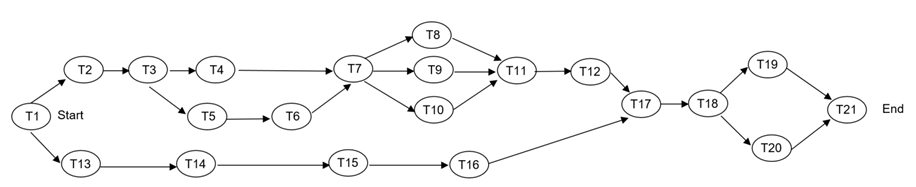
Figure 5.1: Critical Path Method (CPM)
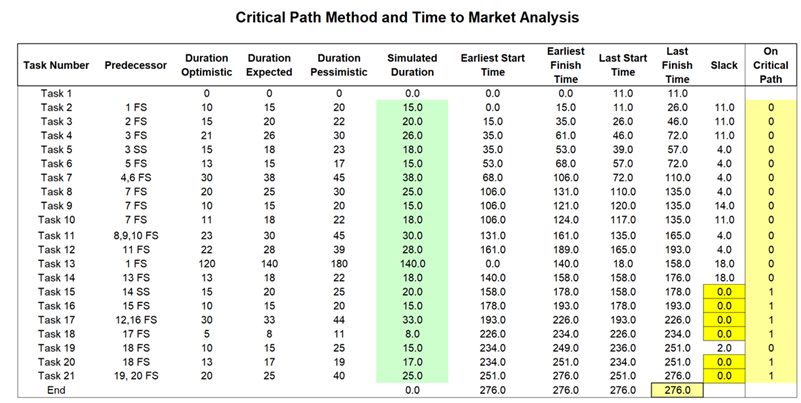
Figure 5.2: Critical Path Method (CPM)
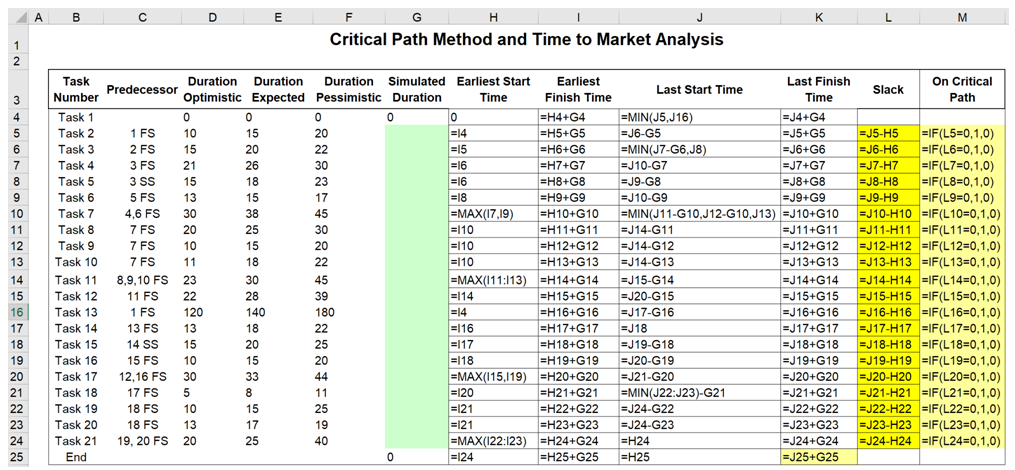
Figure 5.3: Manual Computations