Theory
Sometimes there are missing values in a time-series dataset. For instance, interest rates for years 1 to 3 may exist, followed by years 5 to 8, and then year 10. Spline curves can be used to interpolate the missing years’ interest rate values based on the data that exist. Spline curves can also be used to forecast or extrapolate values of future time periods beyond the time period of available data. The data can be linear or nonlinear. Figure 11.21 illustrates how a cubic spline is run and Figure 11.22 shows the resulting forecast report from this module. The Known X values represent the values on the x-axis of a chart (in our example, this is Years of the known interest rates, and, usually, the x-axis values are those that are known, such as time or years) and the Known Y values represent the values on the y-axis of a time-series chart (in our case, the known Interest Rates). The y-axis variable is typically the variable you wish to interpolate missing values from or extrapolate the values into the future.
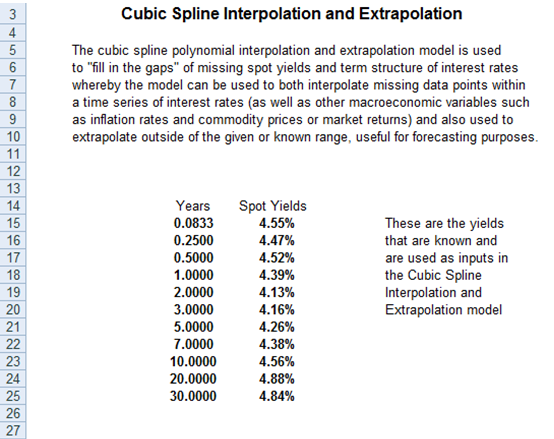
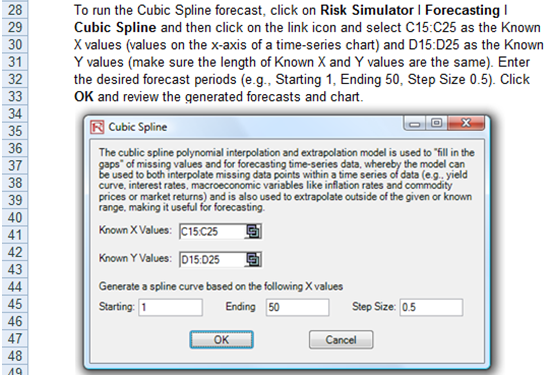
Figure 11.21: Cubic Spline Module
Procedure
- Start Excel and open the example file Advanced Forecasting Model, go to the Cubic Spline worksheet, select the dataset excluding the headers, and click on Risk Simulator | Forecasting | Cubic Spline.
- The data location is automatically inserted into the user interface if you first select the data, or you can also manually click on the link icon and link the Known X values and Known Y values(see Figure 11.21 for an example), then enter the required Starting and Ending values to extrapolate and interpolate, as well as the required Step Size between the starting and ending values. Click OK to run the model and report (see Figure 11.22).
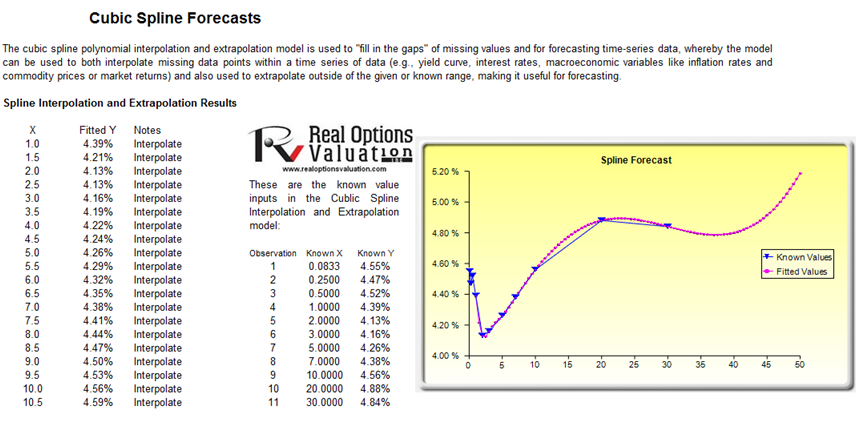
Figure 11.22: Spline Forecast Results