The Optimization Results tab returns the results from the portfolio optimization analysis. For instance, Figure 8.2. shows the results after running the saved Optimization Efficient Frontier – Budget model from the Optimization Settings tab. The main results are provided in the data grid (lower left corner), showing the final Objective function result, final Constraints, and the allocation, selection, or optimization across all individual Projects within this optimized portfolio. The top left portion of the screen shows the textual details of the optimization algorithms applied, and the chart illustrates the final objective function (the chart will only show a single point for regular optimizations, whereas it will return an investment efficient frontier curve if the optional Efficient Frontier settings are set [min, max, step size] in the Optimization Settings tab).
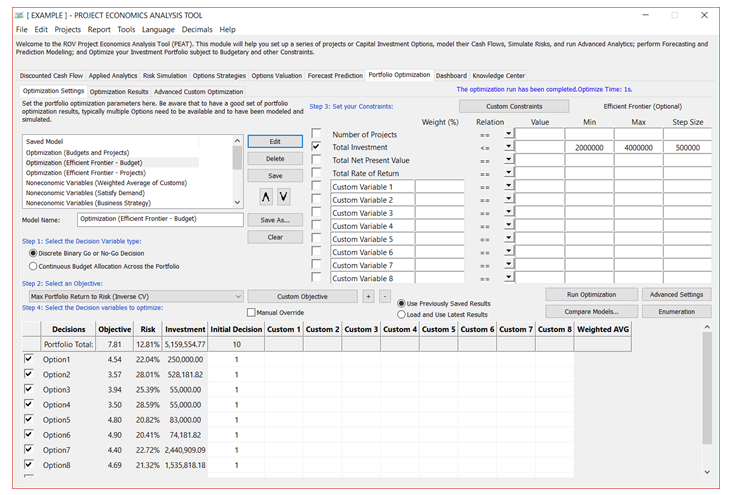
Figure 8.1 – Portfolio Optimization: Optimization Settings
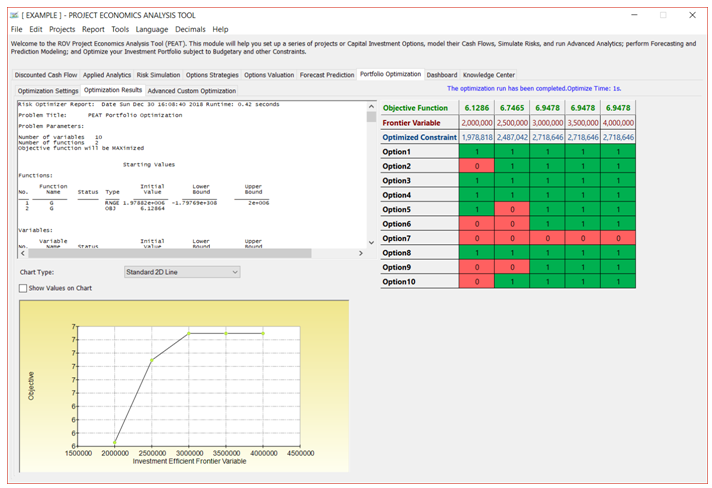
Figure 8.2 – Portfolio Optimization: Optimization Results