Endogeneity occurs when a dependent variable in a model is also the independent variable in another model. The simplest example would be the structural equation model with partial least squares as shown previously. The SEM model is best used when there are complex combinations of pathways. Sometimes there are only two equations in the system, and, hence, these can be solved using a simultaneous equations model approach. Recall from basic algebra when you have two equations and two unknowns, you can solve them using simultaneous equations. The same applies here when we have a system of two equations.
Suppose we have two equations: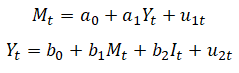
![]() is money supply at time t,
is money supply at time t, ![]() is income at time t, and
is income at time t, and ![]() is the investment at time t. We see that M depends on Y in the first equation, but Y depends on M and I in the second equation. In this example, M and Y are endogenous or jointly determined, meaning that they cannot be modeled by themselves, and must be modeled together or simultaneously. However, I is an exogenous variable, which can be determined outside of this system of equations. In this example, the number of endogenous variables (k) is 2 and the number of exogenous variables (r) is 1. If r = k – 1, then it is considered to be exactly identified. The system of equations is overidentified or under-identified if exceeds or is smaller than k – 1. The system can only be modeled when the system is exactly identified or overidentified. Figure 9.46 illustrates the two-stage least squares model. The calculated model returns the following:
is the investment at time t. We see that M depends on Y in the first equation, but Y depends on M and I in the second equation. In this example, M and Y are endogenous or jointly determined, meaning that they cannot be modeled by themselves, and must be modeled together or simultaneously. However, I is an exogenous variable, which can be determined outside of this system of equations. In this example, the number of endogenous variables (k) is 2 and the number of exogenous variables (r) is 1. If r = k – 1, then it is considered to be exactly identified. The system of equations is overidentified or under-identified if exceeds or is smaller than k – 1. The system can only be modeled when the system is exactly identified or overidentified. Figure 9.46 illustrates the two-stage least squares model. The calculated model returns the following: ![]()
As another example, when we have an overidentification system, where the second equation above has an additional exogenous variable G, such that:![]()
The result is shown in Figure 9.47, where the computed model is:![]() The two-stage least squares approach involves regressing each of the endogenous variables on all the exogenous variables to obtain the predicted values of these endogenous variables to estimate the structural equations model.
The two-stage least squares approach involves regressing each of the endogenous variables on all the exogenous variables to obtain the predicted values of these endogenous variables to estimate the structural equations model.
Sometimes, with random data, it is hard to determine if a certain variable is endogenous. The Durbin–Wu–Hausman test can be used to determine endogeneity. For example, Figure 9.48 illustrates the test, where the null hypothesis is that there is no endogeneity. With a low p-value of 0.003, we reject this null hypothesis and conclude that there is, indeed, endogeneity among the variables.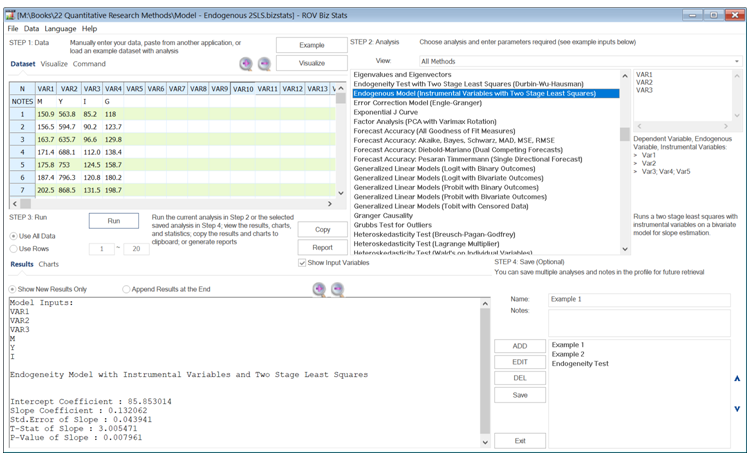
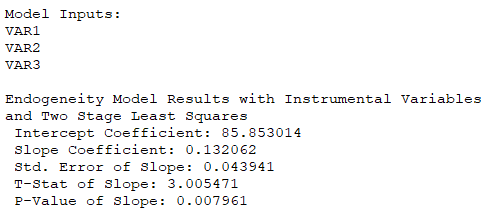
Figure 9.46: Two-Stage Least Squares I
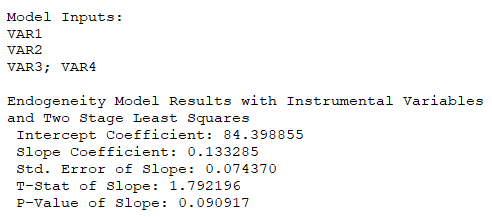
Figure 9.47: Two-Stage Least Squares II
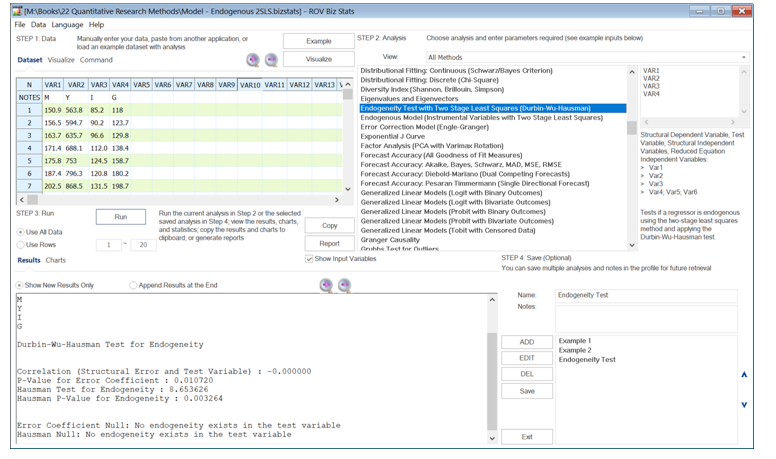
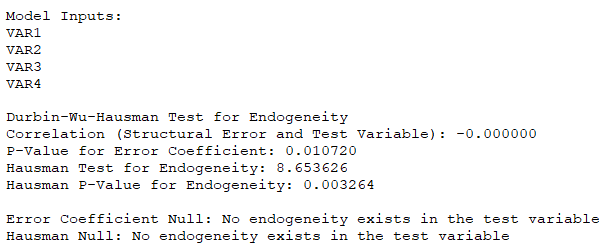
Figure 9.48: Testing for Endogeneity