File Name: Analytics – Central Limit Theorem (Winning Lottery Numbers)
Location: Modeling Toolkit | Analytics | Central Limit Theorem – Winning Lottery Numbers
Brief Description: Uses distributional fitting on past winning lottery numbers and illustrates the Central Limit Theorem and the Law of Large Numbers
Requirements: Modeling Toolkit, Risk Simulator
This fun model is used to illustrate the behavior of seemingly random events. For the best results, first review the Central Limit Theorem model in Chapter 1 before going over this example model. As in the Central Limit Theorem model, tossing a single six-sided die will yield a discrete uniform distribution with equal probabilities (1/6) for each side of the die. In contrast, when a pair of dice is tossed, there are 36 permutations of outcomes, and the sum of each of the 36 outcomes actually follows a discrete normal distribution. When more dice are tossed, the resulting sums are normally distributed. The same concept applies here.
Suppose that in a lottery there are 6 numbers you have to choose. First, you choose 5 numbers ranging from 1 to 47, without repetition, and then, you choose the sixth special number, from 1 to 27. You need to hit all 6 numbers to win the lottery jackpot. Clearly, assuming that the lottery balls selected at random are truly random and fair (i.e., the State Lottery Commission actually does a good job), then over many trials and many lottery games, the distribution of each value selected follows a discrete uniform distribution. That is, the probability of the number 1 being chosen is 1/47, and the probability of the number 2 being chosen is also 1/47, and so forth.
However, if all of the 5 balls that are randomly chosen between 1 and 47 are summed, an interesting phenomenon occurs. The Historical worksheet in the model shows the actual biweekly historical lottery winning numbers for several past years. Summing up the 5 values and performing a distributional fitting routine using Risk Simulator reveals that the distribution is indeed normal.
The probability of hitting the jackpot is clearly very small. In fact, this can be computed using a combinatorial equation. The probability of selecting the 5 exact numbers out of 47 is 1 out of 1,533,939 chances. That is, we have:
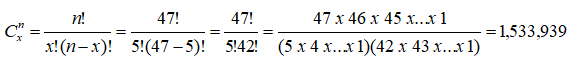
where C represents the number of possible combinations, n is the total number of balls in the population, and x represents the total number of balls chosen at a time.
The chances of choosing the sixth special number are 1 out of 27, hence, the probability is 1/27. Therefore, the chance of choosing the correct 5 numbers and the special number is 1,533,939 × 27 = 41,416,353. So, the odds are 1 in 41,416,353 or 0.000002415% probability of hitting the jackpot. In fact, from the State Lottery Commission, we see that the published odds are exactly as computed (Figure 2.1).
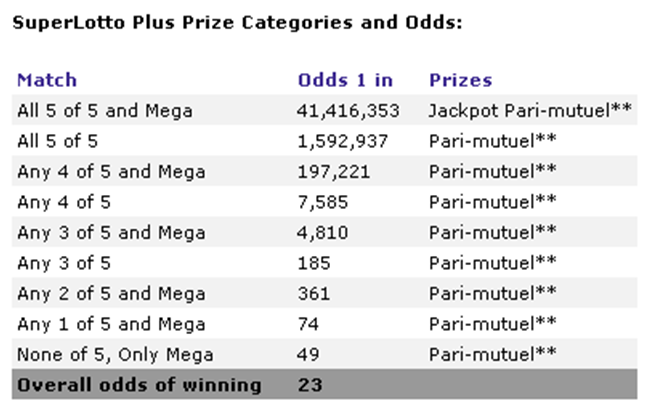
Figure 2.1: Lottery winnings and payoffs
Also as expected, performing a data-fitting routine to the raw numbers (the first 5 values between 1 and 47), we have a discrete uniform distribution (see Figure 2.2 or the Report 2 worksheet in the model).
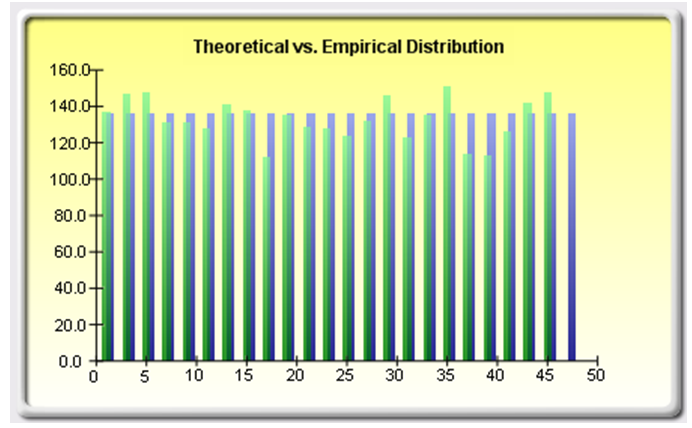
Figure 2.2: Lottery numbers and the discrete uniform distribution
However, when we performed a data fitting on the sum of the 5 values, we obtain an interesting result. The distribution is, as expected, normal (see Figure 2.3 or the Report worksheet in the model). In fact, running the simulation 10,000 trials using the fitted normal assumption, we obtain the forecast results seen in Figure 2.4.
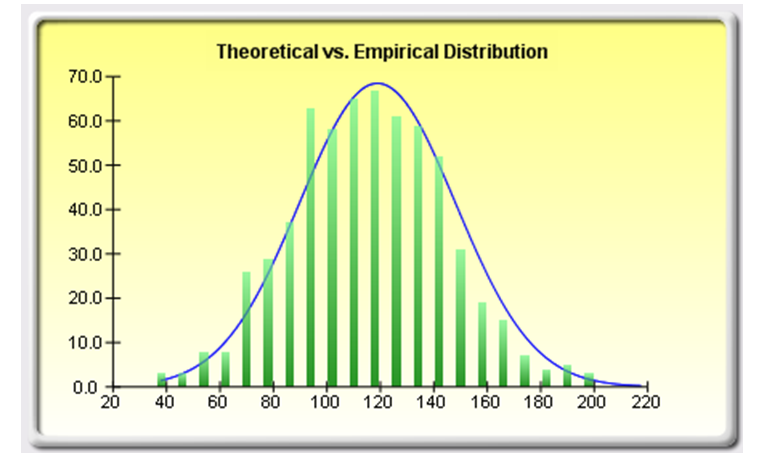
Figure 2.3: Sum of the lottery numbers are normally distributed
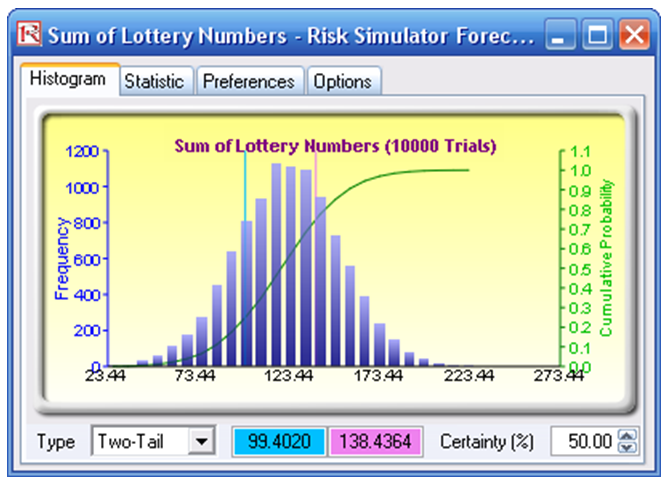
Figure 2.4: Simulation of lottery numbers
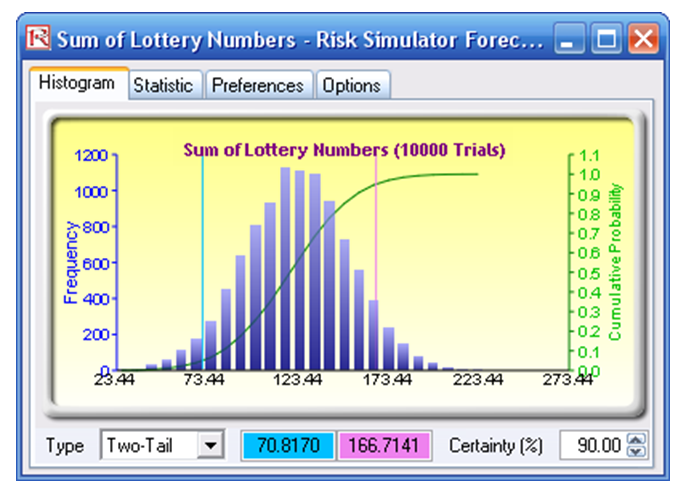
Figure 2.5: Confidence interval of lottery results
The theoretical distribution predicts that 90% of the time, the sum of the first five winning lottery numbers will be between 71 and 167 (rounded), and 50% of the time, they will be between 99 and 138 (rounded), as seen in Figures 2.4 and 2.5. We then looked at the raw historical winning numbers and computed the percentage of winning sequences that fall within this range, and the actual statistics are shown in Figure 2.6.
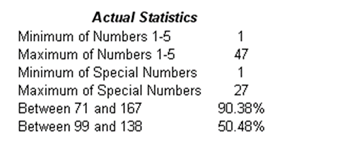
Figure 2.6: Actual empirical statistics of lottery drawings
Sure enough, the empirical statistics of actual winning numbers are very close to the theoretically predicted values. This means that, if you followed the statistics and picked the first 5 numbers such that the sum of the 5 values is within 71 and 167, your odds will have significantly improved! This is, of course, only an academic example and does not guarantee any results. So, don’t go rushing out to buy any lottery tickets!