File Names: Valuation – Valuation Model; Valuation – Financial Statements; Valuation – Financial Ratios Analysis
Location: Modeling Toolkit | Valuation | Valuation Model, Financial Statements, Financial Ratios Analysis
Brief Description: Illustrates the use of Monte Carlo simulation methods on standard discounted cash flow models
Requirements: Modeling Toolkit, Risk Simulator
These valuation models are based on standard discounted cash flow and financial statement approaches, useful for generating standard financial statements and computing financial ratios, and have been modified to account for the earnings per share of a company under uncertainty.
In this example model, we run a Monte Carlo simulation on the forecast projections of a company’s profitability, as modeled in an income statement and earnings per share valuation. Figure 155.1 shows a simple screenshot of the Valuation model, where the boxed cells are the input assumptions in the valuation of the firm. The model then takes these input assumptions as starting points and forecasts the income statement, balance sheet, cash flow statement, and some financial ratios. Using these financial statements, the valuation of the firm is obtained (Figure 155.2). The valuation flows through these financial statements in order to obtain the net operating profit after taxes (NOPAT). From this NOPAT value, adjustments on tax-related items and noncash expenses are added back to determine the free cash flows available to the firm.
Then, the company’s net present value is computed as the sum of the present value of future cash flows. This is the firm’s present value of operations (PVO). We then add PVO to the value of continuation (value of the firm to perpetuity) assuming some growth rate and the weighted average cost of capital. The total value is called the enterprise value, which is the valuation of the firm.
To get a more detailed look at the three key financial statements, refer to the Modeling Toolkit | Valuation | Financial Statements model. These models also provide a list of typical financial ratios. Please refer to Appendix B for details and definitions of these ratios (see the functions list with a MTRatios prefix).
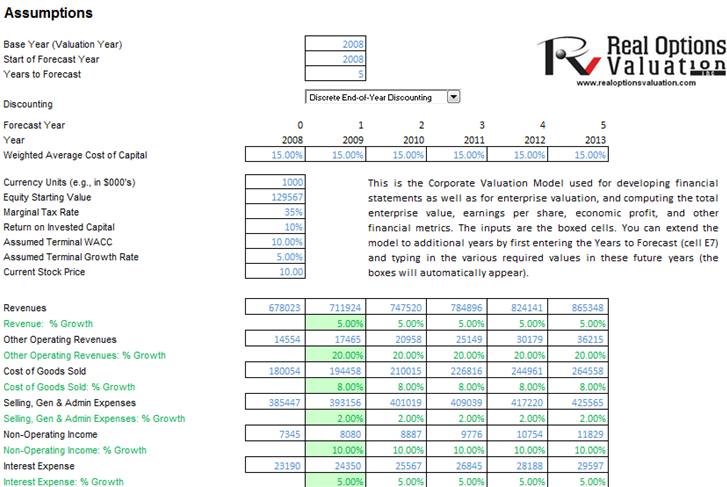
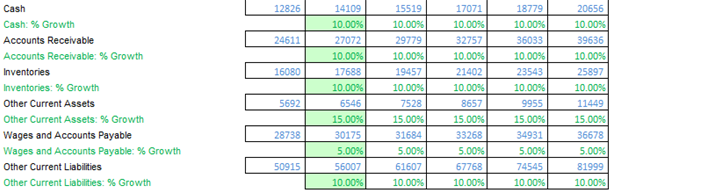
Figure 155.1: Simulation and valuation on income statements and earnings per share
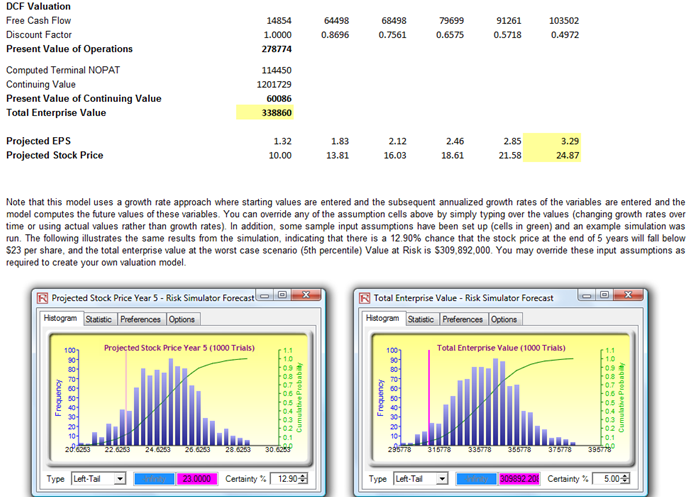
Figure 155.2: Valuation results