The one-way ANOVA models presented above look at a single factor on the dependent variable. In this section, we introduce the two-way ANOVA, a method that simultaneously examines the effects of two factors (two categorical independent variables) on the one numerical dependent variable, as well as the interactions of different levels of the two factors. That is, random assignments are made such that two or more participants are subjected to each possible combination of the factor levels. The number of persons or participants within each of these combinations is termed the number of replications (r) and r ≥ 2.
The specification tested in this ANOVA is ![]()
Testing the main effect, factor A:
H0: αi = 0 for each level of factor A, for i = 1 to α (no level of factor A has an effect)
Ha: αi ≠ 0 for at least one value of i, where i = 1 to α (at least one level has an effect)
Testing the main effect, factor B:
H0: βi = 0 for each level of factor B, for j=1 to β (no level of factor B has an effect)
Ha: βi ≠ 0 for at least one value of j, where j=1 to β (at least one level has an effect)
Testing the interaction effects, between levels of factors A and B:
H0: αβij = 0 for each combination of i and j (there are no interaction effects)
Ha: αβij ≠ 0 at least one combination of i and j (at least one combination has an effect)
Example: Suppose an aircraft manufacturer is testing three different alloys (B1, B2, and B3) for its wing construction of a new plane, and each alloy type can be produced in four different thickness levels (A1 to A4). The number of twists and flexes is recorded until stress failure is detected. The data is then subjected to a two-way ANOVA as shown in Figure 9.20,which illustrates how the data is set up. The detailed calculations and results are shown in Figure 9.21, and Figure 9.22 shows how to set up the model in ROV BizStats.
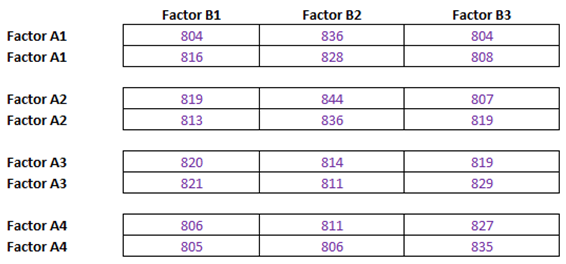
Figure 9.20: Two-Way ANOVA Settings and Results
The method’s specifications are:
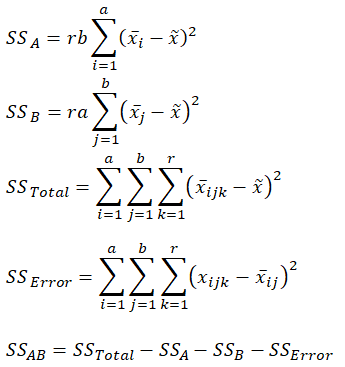
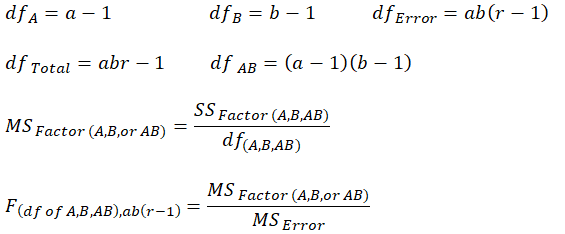
Figure 9.21 illustrates these calculations in more detail. In this figure, you can see that the row factor A is significant at the 0.10 level, while the column factor B and interaction AB are statistically significant at the 0.01 level. We can conclude that at least one level of A and B, and at least one combination of A and B have a significant effect.
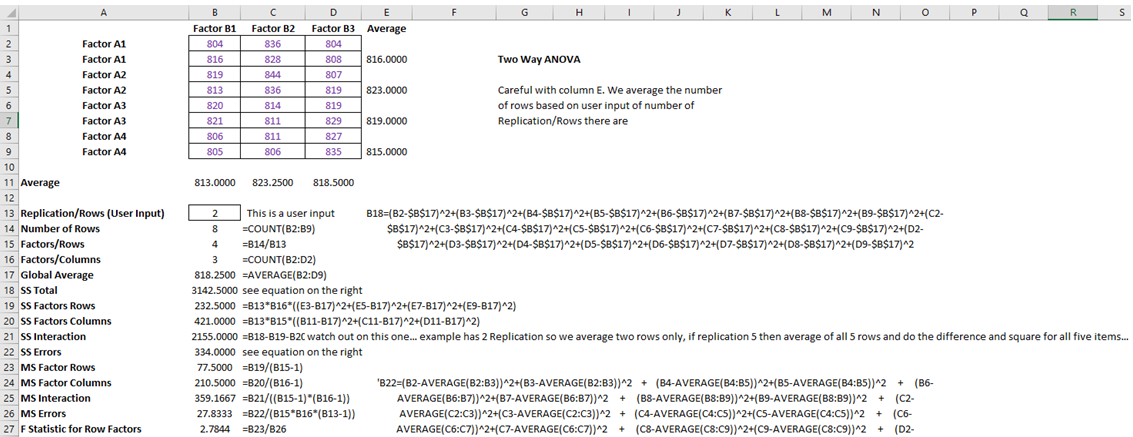
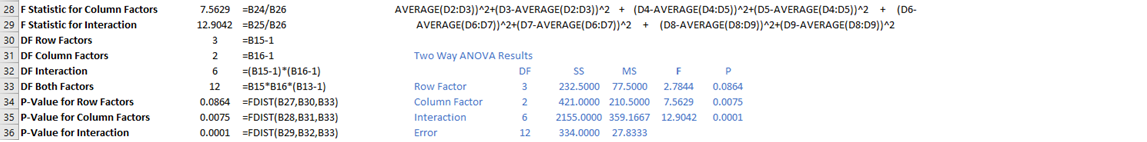
Figure 9.21: Two-Way ANOVA Calculations
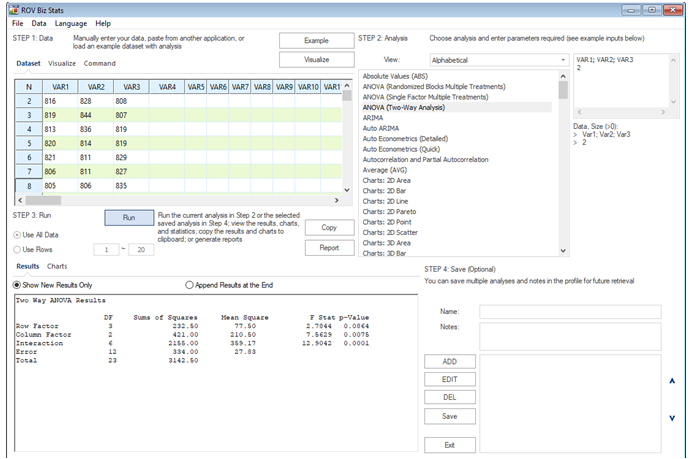
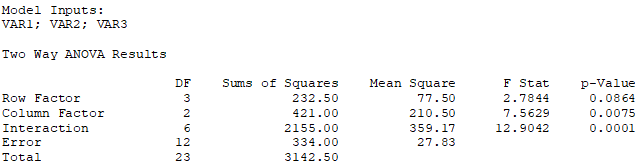
Figure 9.22: Two-Way ANOVA in ROV BizStats