In other types of Risk Registers, Likelihood (L) and Impact (I) values can be used and entered for each risk element, and the product of these two variables is termed the Key Risk Indicator (KRI), where KRI = L × I. These KRI values can be color coded into various regions based on their respective values. For instance, Figure 1.3 shows a 10 × 10 matrix where the columns going from left to right represent the Likelihood from 1 to 10 (low to high), and the rows from bottom to top represent the Impact from 1 to 10 (low to high). The values inside each of the cells represent the KRI, and the color coding depends on the computed KRI (typically, lower KRI values are green, medium KRI values are yellow, and high KRI values are red). In a later section, we showcase examples of how these KRI values can be incorporated into the ERM Risk Register. As will be seen later, the color coding, matrix size, and category labels can be customized as required.
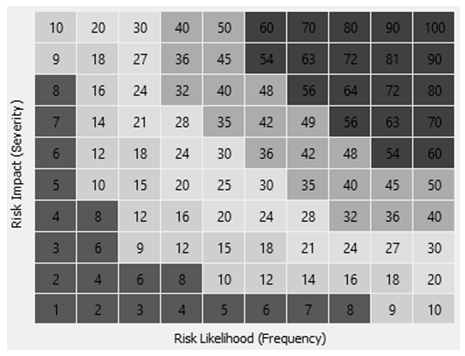
Figure 1.3: Risk Matrix