File Name: Forecasting – Econometric, Correlations and Multiple Regression Modeling
Location: Modeling Toolkit | Forecasting | Econometric, Correlations, and Multiple Regression Modeling
Brief Description: Illustrates how to use Risk Simulator for running a multiple regression analysis and econometric modeling
Requirements: Modeling Toolkit, Risk Simulator
This example shows how multiple regression can be run using Risk Simulator. The raw data are arranged in the Cross-Sectional Data worksheet, which contains cross-sectional data on 50 months of a bank’s key risk indicators as they pertain to Basel II/III’s Operational Risk analysis guidance. The idea is to see if there is a relationship between the Impact Losses ($M) per month and these explanatory variables using multiple regression, econometric modeling, and correlation analysis.
Procedure
To run this model, simply:
- In the Cross Sectional Data worksheet, select the area C5:H55 (Figure 81.1).
- Select Risk Simulator | Forecasting | Multiple Regression.
- Choose Impact Losses as the dependent variable in the regression and click on OK to run the regression (Figure 81.2).

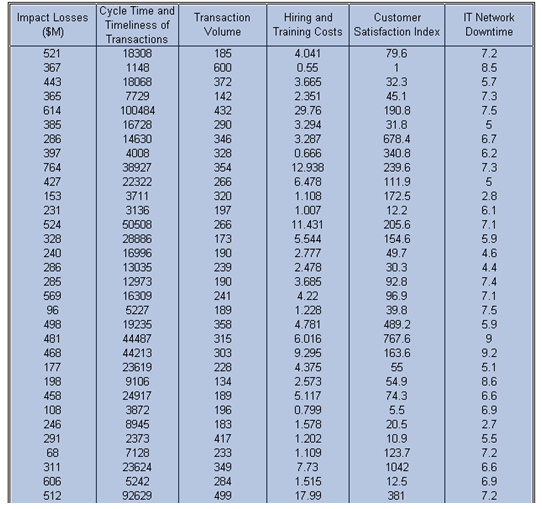
Figure 81.1: Econometric dataset
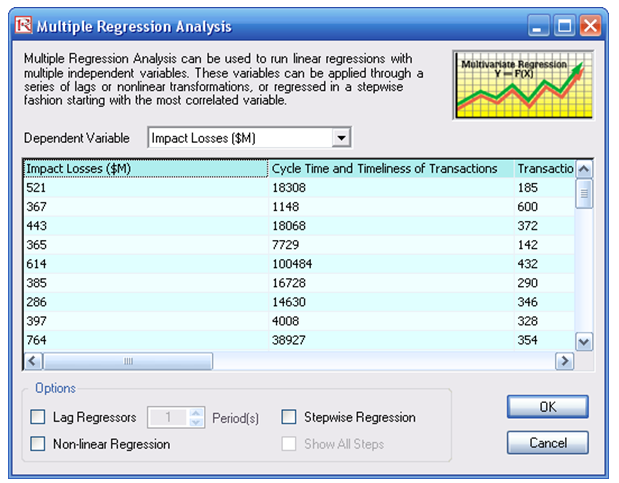
Figure 81.2: Running a multiple regression
Model Results Analysis
Note that more advanced regressions such as lag regressors, stepwise regression, and nonlinear regressions can also be run using Risk Simulator. For more details on running such regressions as well as the interpretation of the regression report, refer to Modeling Risk, Third Edition (Thomson–Shore, 2015) by Dr. Johnathan Mun.
Results Summary
Refer to the Report worksheet for details on the regression output. The report has more details on the interpretation of specific statistical results. It provides these elements: multiple regression and analysis of variance output, including coefficients of determination; hypothesis test results (single variable t-test and multiple variable F-test); computed coefficients for each regressor; fitted chart; and much more.
Additional econometric analyses can be performed. For instance, a nonlinear relationship is appropriate here. Simply follow the three-step procedure described but remember to check the Nonlinear Regression box before hitting OK. Also, interactions between variables might exist in this model, and a modification of the data variables can be done before further regression models are run. In such instances, combine various independent variables to create new variables (e.g., X1, X2, … Xn, and X1X2, X1X3, X1X4, and so forth, and then run a Stepwise Regression). In addition, the Basic Econometrics tool in Risk Simulator can be used to first modify these dependent and independent variables on-the-fly, before a regression is run.
Finally, the previous chapter, Forecasting – Data Diagnostics, provides the critical modeling prerequisites before running any multivariate regression analysis, to make sure that all the required assumptions have not been violated in the dataset and to check the modeling and predictive quality of the data.
Sometimes, the variables themselves require tweaking before a multiple regression is run. This is the basics of econometrics. Using Risk Simulator, this process can be applied quickly, and the variables can be manipulated (log, addition, subtraction, multiplication, lagged, and so forth, using the Basic Econometrics tool) and modeled. The procedure is described next.
Procedure
To run a basic econometrics model, simply:
- In the Cross Sectional Data worksheet, select the area C5:H55 (Figure 81.1).
- Select Risk Simulator | Forecasting | Basic Econometrics.
- Type in the required single dependent variable and multiple independent variables with the required modifications but separated by a semicolon (Figure 81.3). Click Show Results to view the results of this model, and make additional modifications as required, and when done, click on OK to generate the full model report as seen in Figure 81.4.
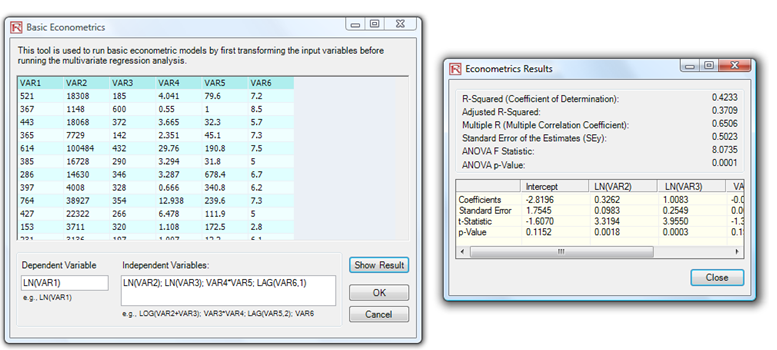
Figure 81.3: Basic econometrics results
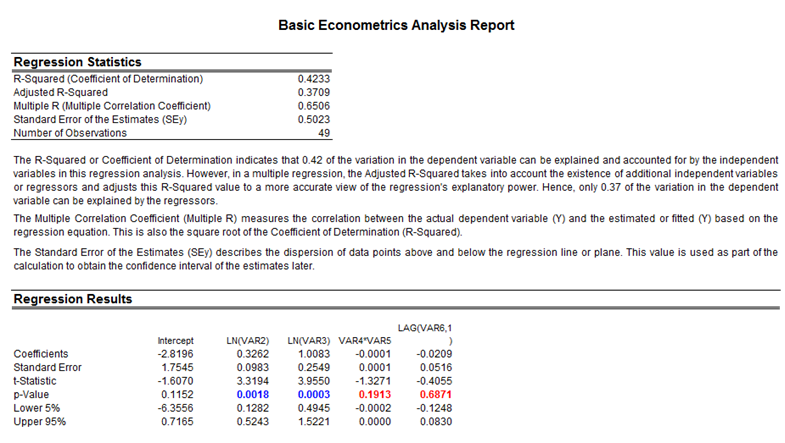
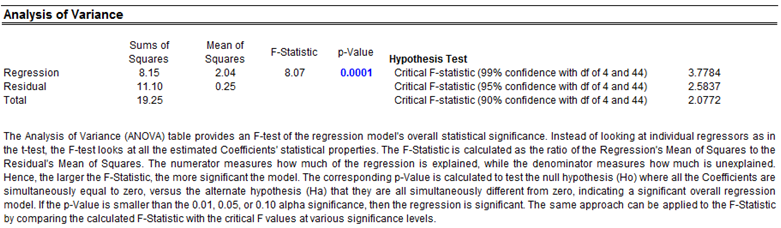
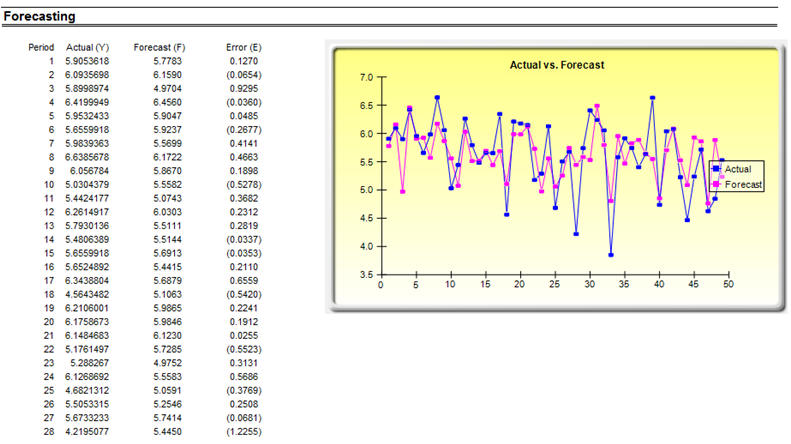
Figure 81.4: Basic econometrics report