The Multiple Analysis of Variance, or MANOVA, extends the ANOVA Single Factor Multiple Treatments model. The Two-Way MANOVA is an extension of the Two-Way ANOVA model. See Figure 9.23 for a comparison of these General Linear Models and Figure 9.24 for examples and the required data setup in BizStats.
As a reminder of the different ANOVA methods, the ANOVA Single Factor Multiple Treatments model variation is used to test for statistical differences of one continuous numerical dependent variable against one categorical independent variable (with multiple subcategories or treatment types). These treatments are collectively considered a single factor that is being tested. As an example, we collect and model math test scores of 90 students (the math test scores are continuous values and are collectively considered the single dependent variable) that have been randomly assigned into three different treatment groups (e.g., Russian Math, Singapore Math, U.S. Math) to see if the three different teaching techniques generate statistically significant differences in math aptitude. In this example, the dependent variable is the math test scores (numerical values between 0% and 100%), and the independent variable is the different math teaching techniques (categorical nominal values of the three math teaching techniques).
The ANOVA Single Factor Repeated Measures is used when the researcher wishes to test the validity of the test instrument used. For example, a group of 30 students is subjected to three math tests at different times. Depending on the research question, these math tests are usually similar (e.g., identical difficulty levels, similar concepts with slightly different questions, identical questions asked slightly differently, similar questions but ordered differently, etc.). There is only one dependent variable (math test scores) and one independent variable (math tests, categorized into first test, second test, or third test).
The ANOVA with Blocking Variables is used to test one dependent variable against one independent variable, while controlling for, or blocking, an exogenous variable that may potentially impact the dependent variable. For example, the three different math teaching techniques (the independent variable) are tested on a group of students, but the type of school (private, public, home school) is controlled for.
A related approach is the ANCOVA, or Analysis of Covariance, where a single factor ANOVA model with repeated treatments (Group 1) after removing the Group 2 covariate effects. The net effects after covariates have been accounted for will be to test the null hypothesis that the various treatments in Group 1 are identical to each other. The covariate effects are used as a benchmark, or base-case control values, of effects that are not of interest to the researcher. Examples of covariate effects may include different family wealth levels of the students or whether the schools are in urban or rural areas. The ANCOVA model requires that these two groups of variables have the same number of variables. Because some controversies surround the use of ANCOVA methods, it might be better to apply multiple regression instead.
Next, the Two-Way ANOVA provides an extension to include one dependent variable against two independent variables, or factors, and their interactions. For example, the same numerical math test scores (dependent variable) are collected but the students are divided into a 3 × 3 factorial design with two-factor treatments (independent variables). For example, Factor A is the different teaching techniques (Russian Math, Singapore Math, U.S. Math) and Factor B is the length of time the math techniques are taught (e.g., 1 month, 3 months, 6 months), to see if Factor A, Factor B, or the Interaction of Factors A & B, causes any perceivable statistical differences in math aptitude test scores.
The Multiple Analysis of Variance, or MANOVA, model extends the Single Factor ANOVA by allowing multiple dependent variables at once against one independent variable. For example, multiple continuous numerical variables are collected, such as math test scores, student satisfaction survey scores, and teacher ratings, and these dependent variables are compared against the single categorical independent variable (e.g., public, private, charter, and home school). MANOVA can be thought of as multiple simultaneous ANOVA runs. However, MANOVA has a few key advantages over ANOVA. It protects against Type I Errors compared to running multiple and independently-run ANOVA models. Sometimes, MANOVA can potentially reveal statistical differences not discovered by running multiple independent ANOVA tests. However, MANOVA can be significantly more complicated than ANOVA, causing ambiguity in drawing concreate conclusions on which independent variable may or may not affect each of the dependent variables.
The Two-Way MANOVA allows for the testing of multiple dependent variables against two independent variables or factors. Extending the example above, we similarly collect multiple continuous numerical variables such as math test scores, student satisfaction survey scores, and teacher ratings, and these dependent variables are compared against two categorical independent variables. The first independent variable factor is the type of school (public, private, charter, and home school) and the second independent variable is the economic condition where the school district is located (wealthy, middle, poor). Figure 9.23 summarizes the main ANOVA/MANOVA methods.
Finally, in other multivariate situations, it would be more appropriate to apply multiple regression models using dummy variables in place of the categorical independent variables.
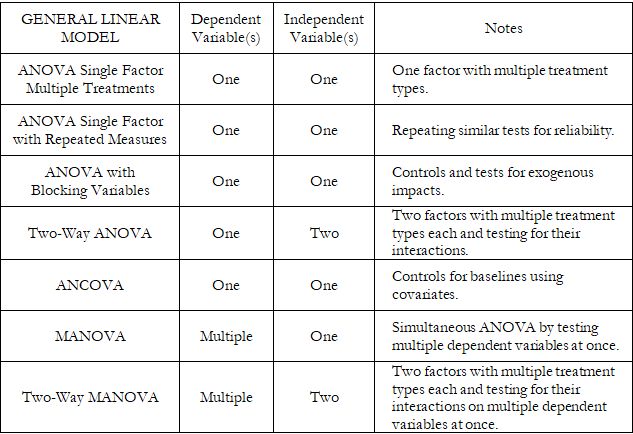
Figure 9.23: ANOVA and MANOVA Methods Comparison
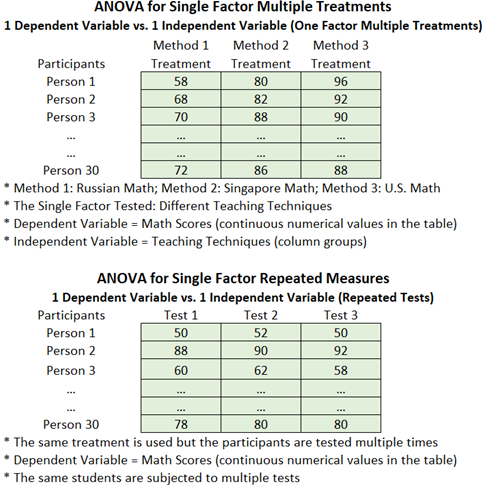
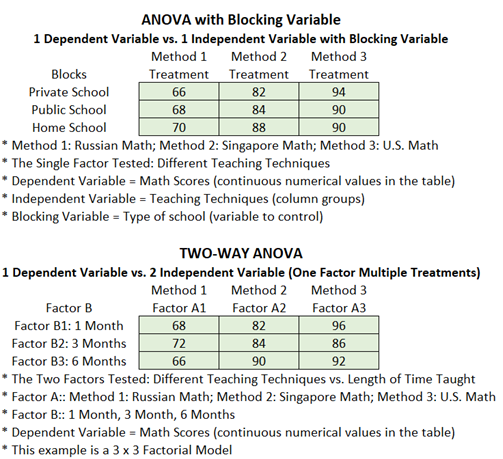
Figure 9.24: ANOVA and MANOVA Examples and Data Setup
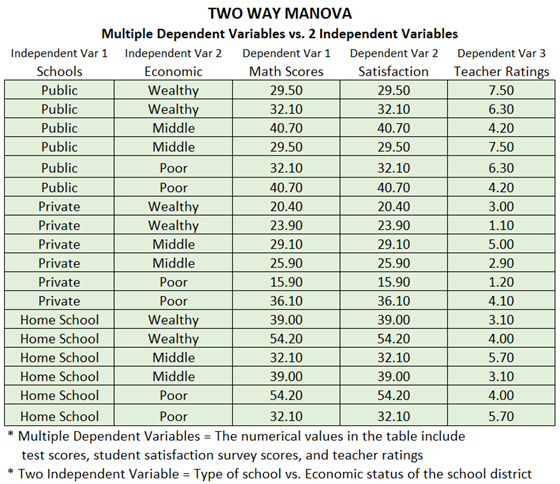
Figure 9.24: ANOVA and MANOVA Examples and Data Setup
Figures 9.25, 9.26, and 9.27 illustrate the results from MANOVA and Two-Way MANOVA models using BizStats. Similar to the ANOVA and Two-Way ANOVA models, the results indicate the various sums of squares, mean squares, degrees of freedom, F-statistics, and p-values for each of the independent variables or factors, as well as their interactions. These results are obtained by running between-subjects tests, similar to the ANOVA models. However, because MANOVA runs multiple dependent variables at once, to reduce the Type I Error impacts, the degrees of freedom and calculated F-statistics will need to be adjusted. The three adjustments for MANOVA are the Pillai’s Trace, Wilk’s Lambda, and Hotelling’s Trace. The computed F-statistics and p-values are interpreted exactly the same way as their ANOVA counterparts.
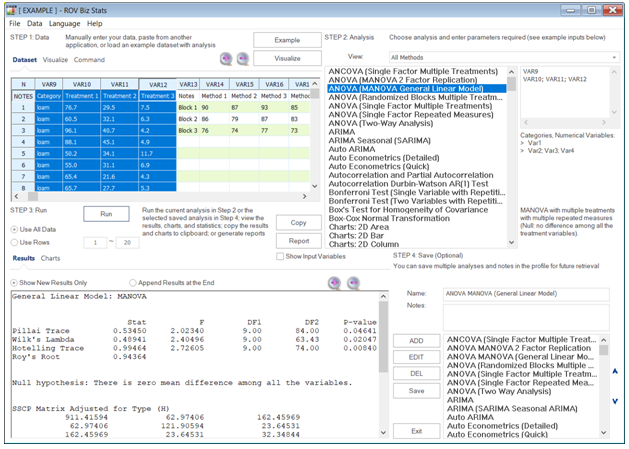
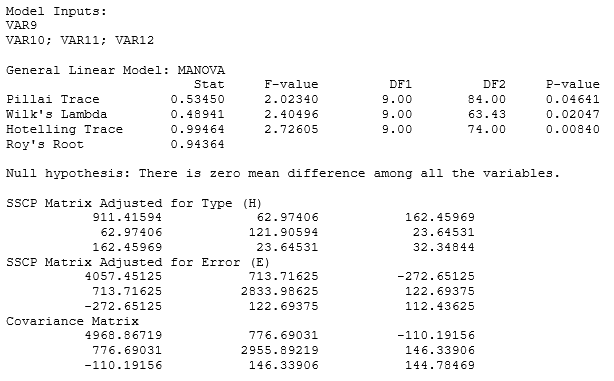
Figure 9.25: MANOVA Results in BizStats
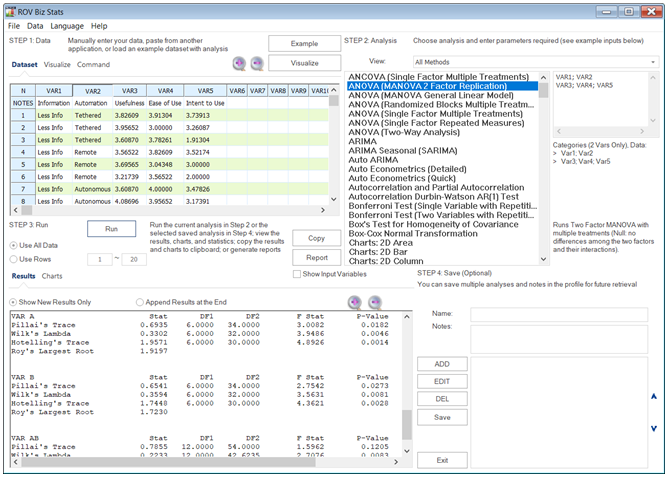
Figure 9.26: Two-Way MANOVA Results in BizStats
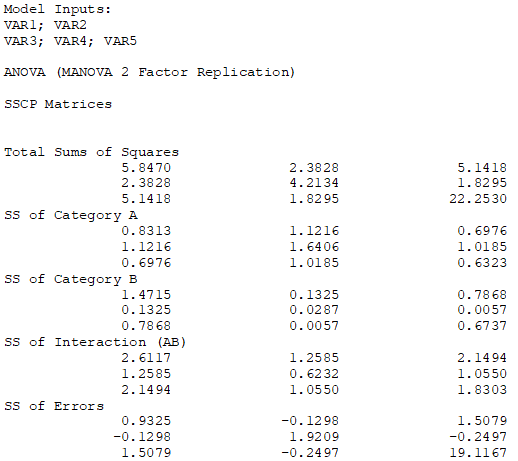
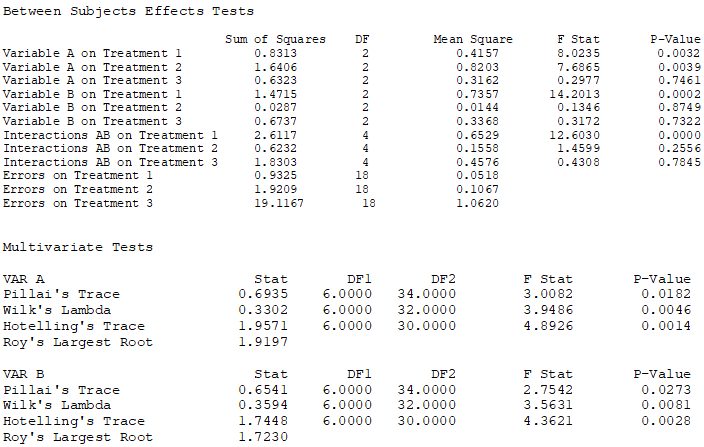
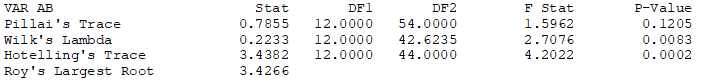
Figure 9.27: Detailed Two-Way MANOVA Results in BizStats