The first VaR example model shown is the Value at Risk – Static Covariance Method, accessible through Modeling Toolkit | Value at Risk | Static Covariance Method. This model is used to compute the portfolio’s VaR at a given percentile for a specific holding period, after accounting for the cross-correlation effects between the assets (Figure 2.9). The daily volatility is the annualized volatility divided by the square root of trading days per year. Typically, positive correlations tend to carry a higher VaR compared to zero correlation asset mixes, whereas negative correlations reduce the total risk of the portfolio through the diversification effect (Figure 2.10). The approach used is a portfolio VaR with correlated inputs, where the portfolio has multiple asset holdings with different amounts and volatilities. Each asset is also correlated to each other. The covariance or correlation structural model is used to compute the VaR given a holding period or horizon and percentile value (typically 10 days at 99% confidence). Of course, the example only illustrates a few assets or business lines or credit lines for simplicity’s sake. Nonetheless, using the functions in the Modeling Toolkit, many more lines, assets, or businesses can be modeled (the function MTVaR CorrelationMethod is used in this example).
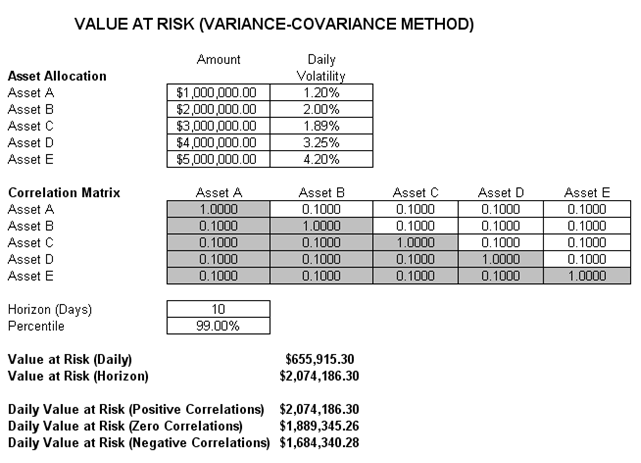
Figure 2.9: Computing Value at Risk with Structural Covariance
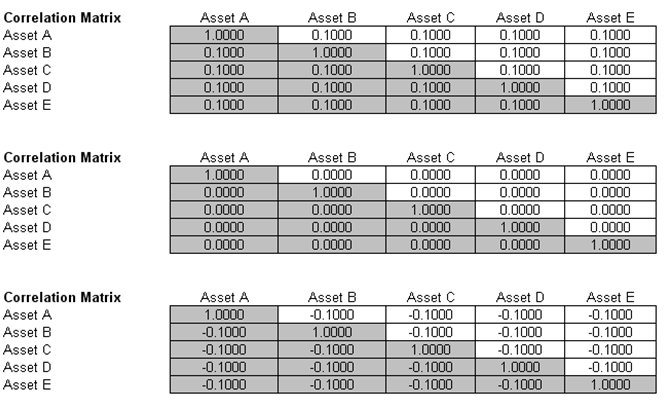
Figure 2.10: Different Correlation Levels