File Names: Real Options – Strategic Cases – R&D Stage-Gate Process A; Real Options – Strategic Cases – R&D Stage-Gate Process B
Location: Modeling Toolkit | Real Options Models
Brief Description: Frames and values a real options application of performing stage-gate development processes versus fast-tracking a development, and the value of information, when the underlying project is filled with risk and uncertainty
Requirements: Modeling Toolkit, Real Options SLS
Suppose BioGen, a large multibillion-dollar pharmaceutical firm is thinking of developing a new type of insulin that can be inhaled and the drug will be absorbed directly into the bloodstream. This is indeed a novel and honorable idea. Imagine what this means to diabetics who will no longer need painful and frequent injections. The problem is, this new type of insulin requires a brand-new development effort. If the uncertainties of the market, competition, drug development, and Food and Drug Administration approval are high, perhaps a base insulin drug that can be ingested should first be developed. The ingestible version is a required precursor to the inhaled version. BioGen can decide to either take the risk and fast-track development into the inhaled version or buy an option to defer, to first wait and see if the ingestible version works. If this precursor works, then the firm has the option to expand into the inhaled version. How much should the firm be willing to spend on performing additional tests on the precursor and under what circumstances should the inhaled version be implemented directly?
Suppose that BioGen needs to spend $100M on developing the inhaled version. If successful, the expected NPV is $24M (i.e., $124M PV Asset less the $100M PV development cost). The probability of technical success, market prices, revenues, and operating expenses are all simulated in the discounted cash flow model. The resulting cash flow stream has a volatility of 22%. In contrast, if BioGen first develops the ingestible version, it will cost $10M and take an entire year to develop, forcing the later phase development of the inhaled version to start one year later. Because this inhaled version uses similar precursors, the development cost is only $95M, not $100M. However, by being one year late to market, the PV Asset of doing an ingestible version before attempting the inhaled version will be reduced to $120M. This means that the ingestible-inhaled strategy will yield an NPV of $15M. Figure 196.1 shows these two competing strategies.
Clearly, under an NPV analysis, the best approach is to pursue the inhaled version directly. However, when a real options analysis is performed by applying a two-phased sequential compound option, the total strategic value is found to be $27.24M, as seen in Figure 196.2. The strategic option value of being able to defer investments and to wait and see until more information becomes available and uncertainties become resolved is worth $12.24M because the NPV is worth $15M ($120M – $10M – $95M). In other words, the Expected Value of Perfect Information is worth $12.24M. This amount indicates that, for the intermediate phase of developing an ingestible precursor that can be used to obtain credible information to decide if further development is possible, the maximum the firm should be willing to spend in the ingestible intermediate phase is on average no more than $22.24M (i.e., $12.24M + $10M). If the cost to obtain the credible information exceeds this value, then it is optimal to take the risk and execute the entire project immediately at $100M, or Strategy B.
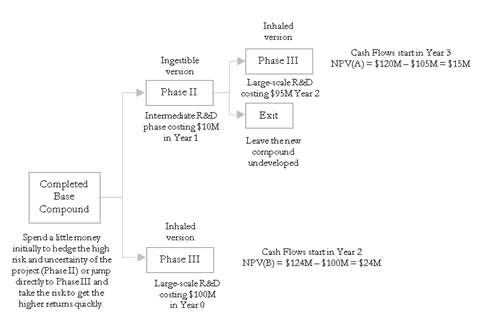
Figure 196.1: Real options strategy tree for pharmaceutical development
In contrast, if the volatility decreases (uncertainty and risk are lower), the strategic option value decreases. In addition, when the cost of waiting (as described by the Dividend Rate as a percentage of the Asset Value) increases, it is better not to defer and wait that long. Therefore, the higher the dividend rate, the lower the strategic option value. For instance, at a 17.20% dividend rate and 22% volatility, the resulting value reverts to the NPV of $15M (Figure 196.3), which means that the option value is zero, and that it is better to execute immediately as the cost of waiting far outstrips the value of being able to wait given the level of volatility (uncertainty and risk). Finally, if risks and uncertainty increase significantly even with a high cost of waiting (e.g., 17.20% dividend rate at 30% volatility), it is still valuable to wait.
This model provides the decision maker with a view into the optimal balancing between waiting for more information (Expected Value of Perfect Information) and the cost of waiting. You can analyze this balance by creating strategic options to defer investments through development stages where at every stage the project is reevaluated as to whether it is beneficial to proceed to the next phase. You can vary the volatility and dividend inputs to determine their interactions––specifically, where the break-even points are for different combinations of volatilities and dividends. Thus, using this information, firms can make better go or no-go decisions (for instance, break-even volatility points can be traced back into the DCF model to estimate the probability of crossing over and this ability to wait becomes valuable).
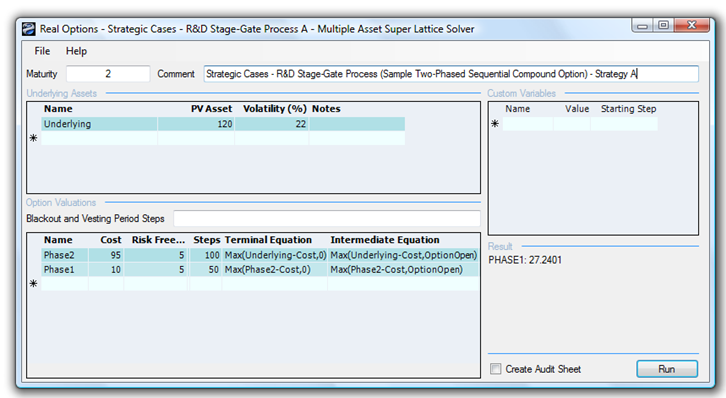
Figure 196.2: Value of Strategy A
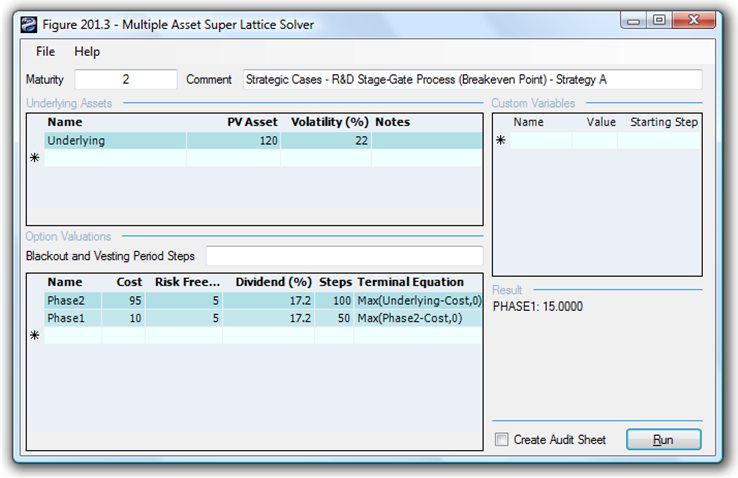
Figure 196.3: Sequential compound option’s break-even point