Theory
Extrapolation involves making statistical forecasts by using historical trends that are projected for a specified period of time into the future. It is only used for time-series forecasts. For cross-sectional or mixed panel data (time-series with cross-sectional data), multivariate regression is more appropriate. This methodology is useful when major changes are not expected, that is, causal factors are expected to remain constant or when the causal factors of a situation are not clearly understood. It also helps discourage the introduction of personal biases into the process. Extrapolation is fairly reliable, relatively simple, and inexpensive. However, extrapolation, which assumes that recent and historical trends will continue, produces large forecast errors if discontinuities occur within the projected time period; that is, pure extrapolation of time series assumes that all we need to know is contained in the historical values of the series being forecasted. If we assume that past behavior is a good predictor of future behavior, extrapolation is appealing. This makes it a useful approach when all that is needed are many short-term forecasts.
This methodology estimates the f(x) function for any arbitrary x value, by interpolating a smooth nonlinear curve through all the x values, and using this smooth curve, extrapolates future x values beyond the historical dataset. The methodology employs either the polynomial functional form or the rational functional form (a ratio of two polynomials). Typically, a polynomial functional form is sufficient for well-behaved data, however, rational functional forms are sometimes more accurate (especially with polar functions, i.e., functions with denominators approaching zero).
Procedure
- Start Excel and enter your data or open an existing worksheet with historical data to forecast (the illustration shown next uses Risk Simulator | Example Models | 10 Nonlinear Extrapolation from the examples folder).
- Select the time-series data and select Risk Simulator | Forecasting | Nonlinear Extrapolation.
- Select the extrapolation type (automatic selection, polynomial function, or rational function are available but in this example, use automatic selection) and enter the number of forecast periods desired (Figure 11.11) and click OK.
Results Interpretation
The report (Figure 11.12) shows the extrapolated forecast values, the error measurements, and the graphical representation of the extrapolation results. The error measurements should be used to check the validity of the forecast and are especially important when used to compare the forecast quality and accuracy of extrapolation versus time-series analysis.
Notes
When the historical data is smooth and follows some nonlinear patterns and curves, extrapolation is better than time-series analysis. However, when the data patterns follow seasonal cycles and a trend, time-series analysis will provide better results. It is always advisable to run both time-series analysis and extrapolation and compare the results to see which has a lower error measure and a better fit.
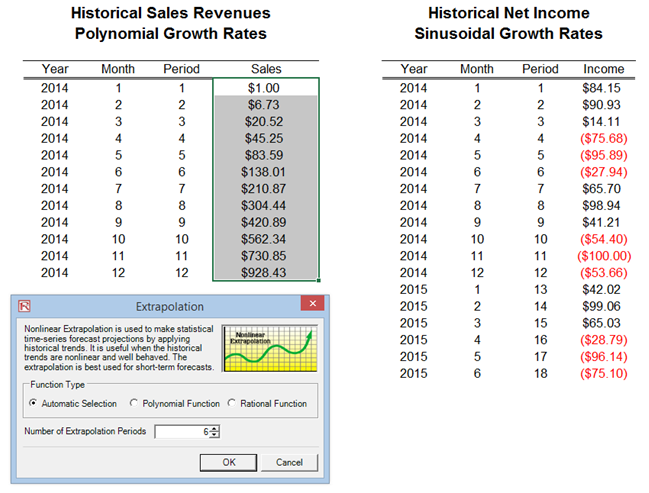
Figure 11.11: Running a Nonlinear Extrapolation
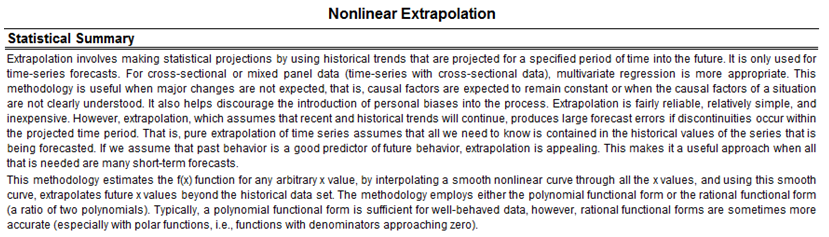
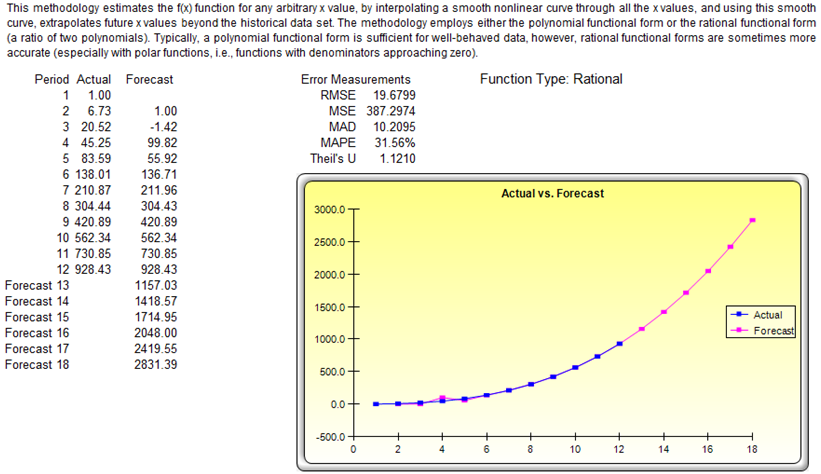
Figure 11.12: Nonlinear Extrapolation Results