The previously described t-tests, z-tests, and F-tests are applied to two variables at a time to determine if their means, proportions, or variances are statistically significantly different or if the small differences are attributable to random chance. When two or more sample means need to be tested at the same time, we resort to Analysis of Variance (ANOVA) tests.
The single ANOVA with multiple treatments tests one categorical independent variable (with multiple treatment levels, types, or categories) and one numerical dependent variable (randomly allocated into the multiple treatment categories) to determine if their population means are equal. Each data column will have a different treatment (e.g., a new method of manufacturing, a new training regimen, a new technology employed). This test assumes that the treatments are completely and randomly assigned to all the persons in the experiment and the underlying data is normally distributed with equal variance. Note that the nonparametric equivalent is the Kruskal–Wallis test, which is presented later in the chapter.
Example: Nine staff members in an organization were randomly divided into three teams each consisting of three individuals, and each team was provided a different type of training. There are three distinct training courses or treatments in this case. Upon completing the training course, each individual was assigned a task to complete and the time it took to complete the task was recorded and shown in the data grid. Because the selection is random, we use the randomized single ANOVA with multiple treatments to test the following hypotheses:
H0: μ1 = μ2 = ⋯ = μt for treatments 1 to t (there is no effect in the treatments)
Ha: Population means are not equal (there is an effect in at least one of the treatments)
Figure 9.13 shows the results from Excel’s Analysis Tool Pak, and Figure 9.14 shows the implementation and results from ROV BizStats.
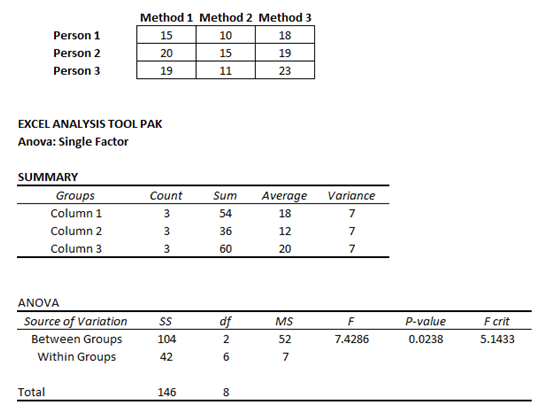
Figure 9.13: Single ANOVA with Multiple Randomized Treatments
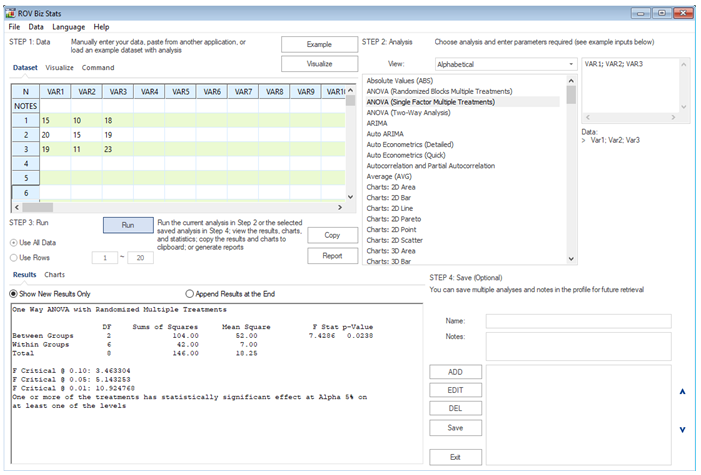
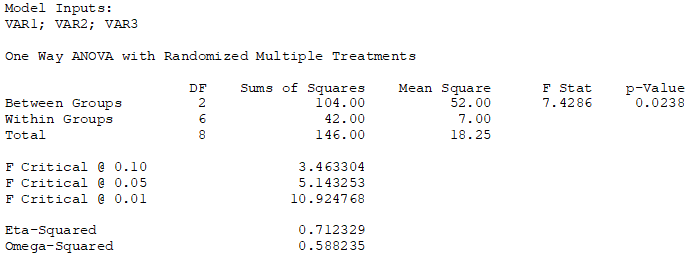
Figure 9.14: Single ANOVA with Multiple Randomized Treatments in ROV BizStats
The specification tested is![]()
and the calculations proceed as follows:
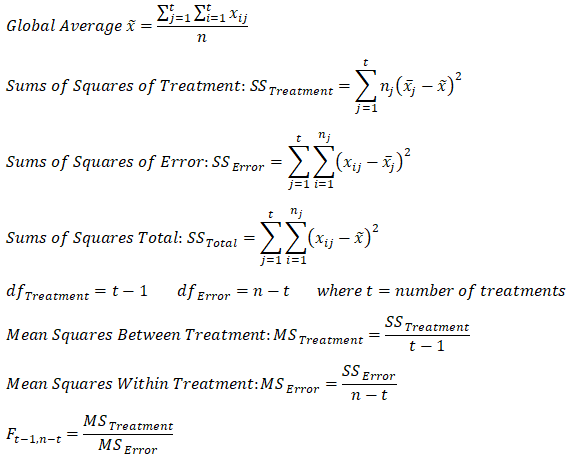
Figure 9.15 shows the implementation of these calculations in Excel.
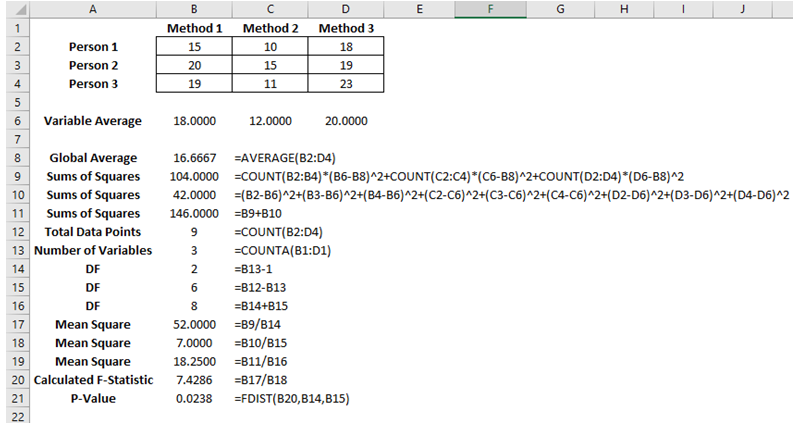
Figure 9.15: Manual Computations of the Single ANOVA
As another example, Figure 9.16 shows results from the single factor ANOVA. The p-value was computed as under the 0.05 threshold, we conclude that at least one of these treatments has a statistically significant effect. The issue with ANOVA is that we cannot determine which of the treatments is effective, just that at least one of them would be effective. To determine which specific treatment is effective, run pairwise t-tests of all possible combinations (AB, AC, BC) or use multivariate regression analysis.
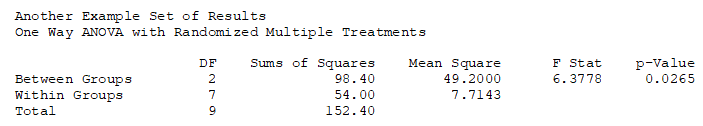
Figure 9.16: Single ANOVA Results