The Runs test evaluates the randomness of a series of observations by analyzing the number of runs it contains. A run is a consecutive appearance of one or more observations that are similar. The null hypothesis tested is whether the data sequence is random, versus the alternate hypothesis that the data sequence is not random.
H0: The sequence is random
Ha: The sequence is not random
For nominal data with two outcomes (e.g., heads and tails in a coin toss, arrival of male and female customers in a bank), the series of events are captured, and the number of runs is computed. For instance, in the series F-M-M-M-F-F-M, there would be a total of 4 runs, or in the series H-H-T-T-T-T-H-H, there would be 3 runs. For ordinal, interval, and ratio data, the median is first calculated, and the runs are converted into + and – signs for above and below the median. Then, a z-statistic is computed based on the number of runs (T) observed, and the total number of observations in each of the types (n1 and n2):
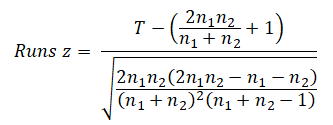
The standard normal p-value is then calculated, assuming, of course, that the sample sizes n1 ≥ 10 and n2 ≥ 10.
Figure 9.32 illustrates a series of 30 data points and the application of the Runs test. The computed z-statistic is –2.23 and the two-tailed p-value is 0.0257, which means we reject the null hypothesis. We conclude that the series is not sufficiently random at 5% significance, as the number of runs observed was only 10, whereas the expected number of runs to be considered statistically random is 16.
Note that the Runs test is nonparametric, which means its statistical power is relatively low. For instance, the following shows some examples of random versus not random sequences.
Case A: 1, 1, 1, 1, 1, 2, 2, 2, 2, 2. This is clearly not random as the values are equal and then jumps and stays equal. BizStats returns a two-tailed p-value of 0.0072 which allows us to reject the null hypothesis of randomness and conclude this series is not random.
Case B: 1, 3, 1, 3, 1, 3, 1, 3, 1, 3. This is clearly not random because there is a predictable sequence where it goes up and down and the series repeats. BizStats returns a two-tailed p-value of 0.0072 which allows us to reject the null hypothesis of randomness and conclude this series is not random.
Case C: 1, 1, 3, 3, 1, 1, 3, 3, 1, 1, 3, 3, 1, 1, 3, 3, 1, 1, 3, 3. This should be non-random but because of the lower testing power of the nonparametric Runs test, the two-tailed p-value computed is 0.6458, stating that this is a random series. Hence, be particularly careful with the Runs test. Other alternate methods should be employed as well, to check for randomness, including the statistical process Control C-Chart.
Case D: 1.25, 1.01, 3.99, 3.12, 1.01, 1.95, 3.02, 3.45, 1.11, 1.25, 3.33, 3.96, 1.55, 1.41, 3.15, 3.61, 1.18, 1.36, 3.05, 3.56. This is actually a similar sequence as Case C, but with additional decimals. At first glance, one might summarily decide that Case C is not random as it follows a discernible pattern, but Case D is random as there is no pattern. However, upon closer inspection, you will see that all we did was to add decimals to the integers, but the same fluctuations around the median occur. In fact, BizStats computes the Run’s test p-value to be exactly the same, at 0.6458, which leads us to conclude that this series is random.
Case E: 8.44, 15.01, 71.65, 32.68, 26.43, 7.00, 73.79, 49.05, 16.43, 39.05, 84.86, 92.15, 89.75, 49.10, 79.34, 37.82. This series looks somewhat random, and the computed p-value is 0.3006, so we cannot reject the null hypothesis and conclude that the series is random.
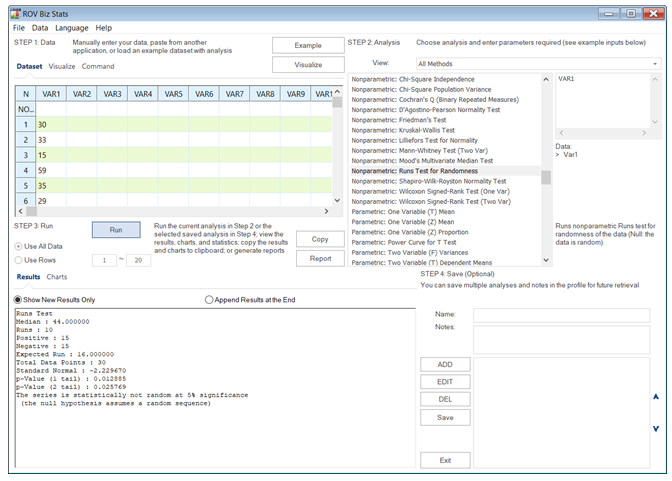
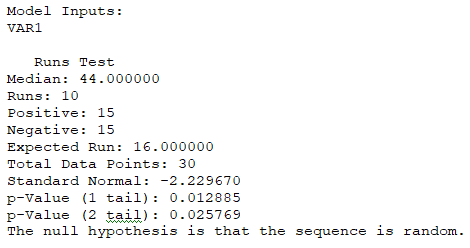
Figure 9.32: Nonparametric Runs Test for Randomness