File Names: Real Options Strategic Cases – Oil and Gas – Strategy A; Real Options Strategic Cases – Oil and Gas – Strategy B
Location: Modeling Toolkit | Real Options Models
Brief Description: Frames and solves a real options problem of choosing among various flexibilities of farmouts and outsourcing, deferring decisions, and the value of information, when the underlying project is filled with risk and uncertainty
Requirements: Modeling Toolkit, Real Options SLS
An oil and gas company, NewOil, is in the process of exploring a new field development. It intends to start drilling and exploring a region in Alaska for oil. Preliminary geologic and aerial surveys indicate that there is an optimal area for drilling. However, NewOil faces two major sources of uncertainties: market uncertainties (oil price volatility and economic conditions) and private uncertainties (geological area, porosity, oil pressure, reservoir size, etc.). Using comparable analysis and oil price forecasts, the development of this new oil field is expected to yield a sum PV of $200M, but drilling may cost up to $100M (in present values). The firm is trying to see if any strategic options exist to mitigate the market and private risks as well as to find the optimal strategic path.
Figure 195.1 represents the outcome of a strategic brainstorming activity at NewOil. Specifically, NewOil can simply take the risk and start drilling, shown as Strategy C. In this case, the NPV is found to be $100M, but there are tremendous amounts of risk in this strategy. To reduce the private risk, either a 3D-seismic can be implemented or a series of test wells can be drilled. The 3D-seismic studies will cost about $5M and take only 0.5 years to complete. The information obtained is fairly reliable but still contains significant amounts of uncertainty. In contrast, test wells can be drilled but will cost NewOil $10M and take 2 years to complete. However, test wells provide more solid and accurate information than seismic studies as the quality of the oil, the pressure, caps, porosity, and other geologic factors will become known over time as more test wells are drilled. Finally, to reduce the market risk, specifically the oil price reduction and volatility, NewOil has decided to execute a joint venture with LocalOil, a small second-tier oil and gas engineering company specializing in managing and running oil rigs. NewOil will provide LocalOil 49% of its gross profits from the oil field provided that LocalOil takes over the entire drilling operation at the request of NewOil. LocalOil benefits from a now fully developed oil field without any investments of its own, while NewOil benefits by pulling out its field personnel and saving $30M in total operating expenses during the remaining economic life of the oil rig, but it still captures a 51% share of the field’s production. The question now is which strategic path in Figure 195.1 is optimal for NewOil? Should it take some risks and execute the seismic study or completely reduce the private risk through a series of test wells? Perhaps the risk is small enough such that the opportunity losses of putting off immediate development far surpass the risks taken and the oil field should be developed immediately.

Figure 195.1: Strategy tree for oil and gas
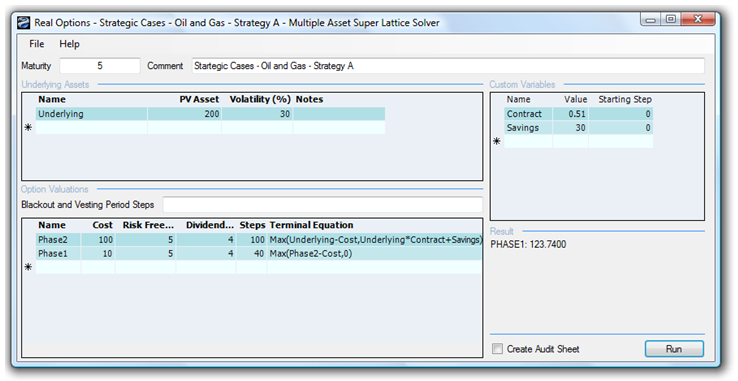
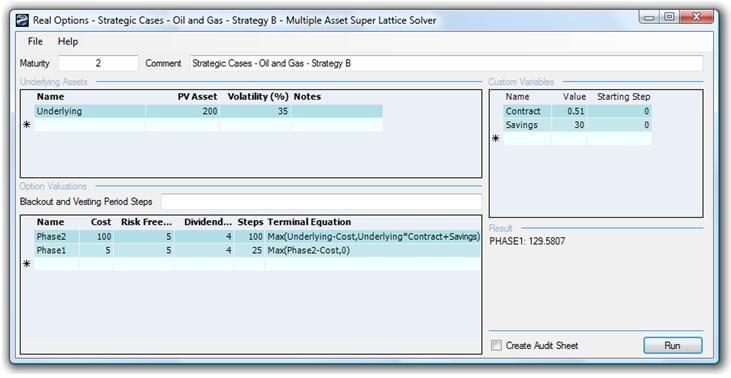
Figure 195.2 shows the valuation of Strategy A. The NPV of Strategy A is $90M, which means that the option value is $33.74M ($123.74M – $90M). This means that putting off development by doing some test wells and farming out operations in the future when oil prices are not as high as NewOil expects is worth a lot. This total strategic value of $123.74 is now compared with the total strategic value of Strategy B valued at $129.58M (Figure 195.3). Clearly, the cheaper and faster seismic study in Strategy B brings with it a higher volatility (Strategy B has a 35% volatility compared to 30% for Strategy A), and having the ability to farm out development of the field is worth more under such circumstances. In addition, the added dividend outflow in Strategy A reduces the option value of deferring and getting more valid information through drilling test wells. Thus, the higher the cost of waiting and holding on to this option, the lower the option value.

Figure 195.2: Value of Strategy A

Figure 195.3: Value of Strategy B

