File Name: Forecasting – Exponential J-Growth Curves
Location: Modeling Toolkit | Forecasting | Exponential J-Growth Curves
Brief Description: Illustrates how to use Risk Simulator for running a simulation model on the Exponential J-growth curve where the growth rate is uncertain over time, to determine the probabilistic outcomes at some point in the future
Requirements: Modeling Toolkit, Risk Simulator
In mathematics, a quantity that grows exponentially is one whose growth rate is always proportional to its current size. Such growth is said to follow an exponential law. This implies that for any exponentially growing quantity, the larger the quantity gets, the faster it grows. But it also implies that the relationship between the size of the dependent variable and its rate of growth is governed by a strict law, of the simplest kind: direct proportion. The general principle behind exponential growth is that the larger a number gets, the faster it grows. Any exponentially growing number will eventually grow larger than any other number that grows at only a constant rate for the same amount of time. Figure 82.1 shows an exponential growth curve.
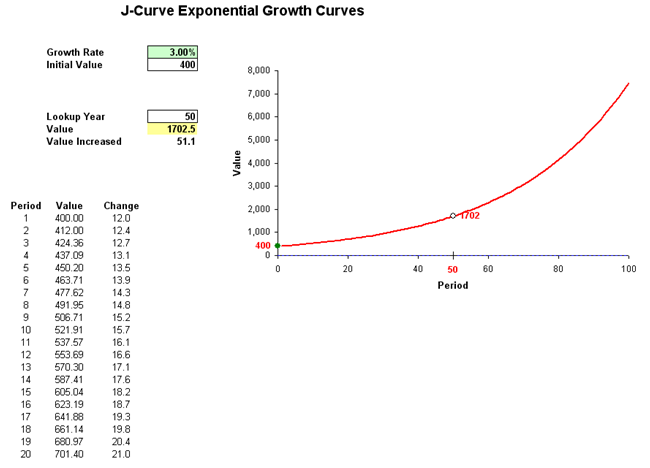
Figure 82.1: Exponential J curve
Procedure
You can run the preset simulation by clicking on Risk Simulator | Change Profile and selecting the J Curve profile, then run the simulation by going to Risk Simulator | Run Simulation. Alternatively, you can set your own or change the underlying simulation assumption as well as the input parameters. The Growth Rate and Initial Value are the input values in the model to determine the characteristics of the J curve. In addition, you can also enter in the Lookup Year to determine the value for that particular year, where the corresponding value for that year is set as a forecast.
Using the initial model inputs and running the simulation yields the forecast charts shown in Figure 82.2. The expected value of Year 50 is 1717.63 units.
An alternative approach is to go to Risk Simulator | Forecasting | J-S Curves to generate forecasts of exponential J curves.
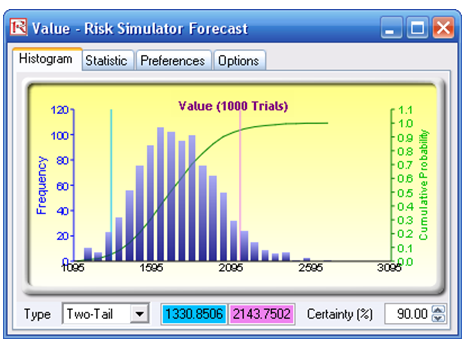
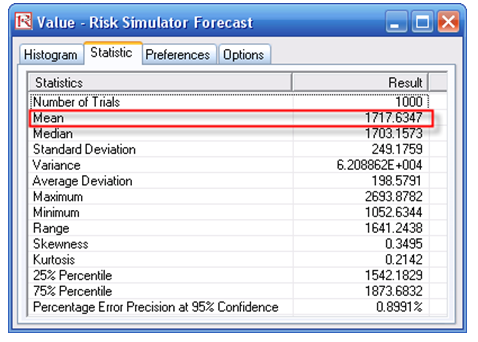
Figure 82.2: Simulated results of a J curve