File Name: Value at Risk – Options Delta Portfolio VaR
Location: Modeling Toolkit | Value at Risk | Options Delta Portfolio VaR
Brief Description: Computes the Value at Risk (VaR) of a portfolio of options and uses closed-form structural models to determine the VaR, after accounting for the cross-correlations among the various options
Requirements: Modeling Toolkit, Risk Simulator
Modeling Toolkit Functions Used: MTVaROptions, MTCallDelta
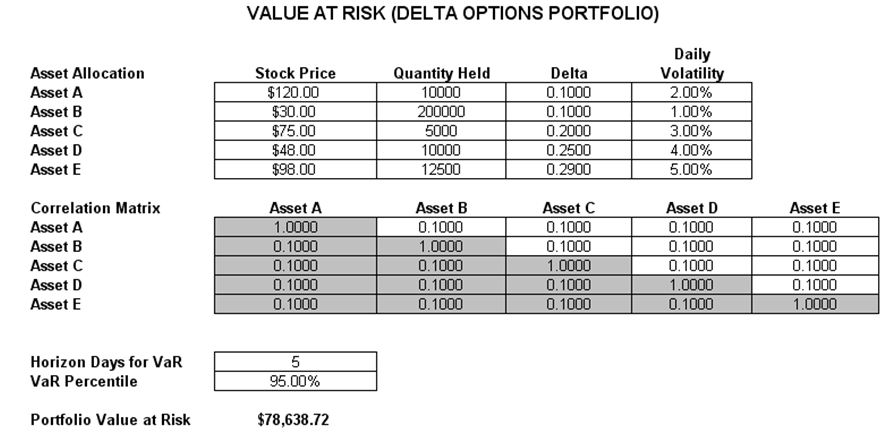
There are two examples in this Value at Risk (VaR) model. The first example illustrates how to compute the portfolio Value at Risk of a group of options, given the options’ deltas (Figure 3.10). The option delta is the instantaneous sensitivity of the option’s value to the stock price for more details on computing an option’s delta sensitivity measure). Given the underlying stock price of the option, the quantity of options held in the portfolio, each option’s delta levels, and the daily volatility, we can compute the portfolio’s VaR measure. In addition, given a specific holding period (typically between 1 and 10 days) or risk horizon days and the percentile required (typically between 90% and 99.95%), we can compute the portfolio’s VaR for that holding period and percentile. If the option’s delta is not available, use the MTCallDelta function instead, or see the Given Option Inputs worksheet.
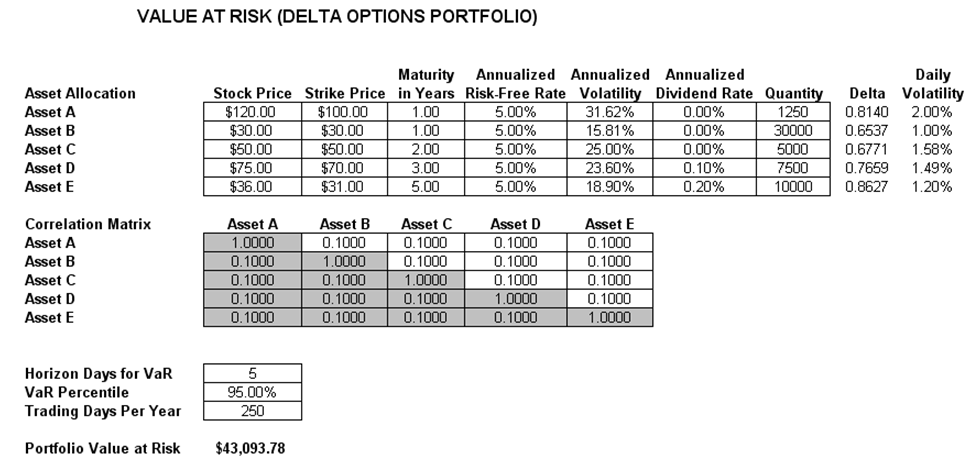
The second example (Figure 3.11) illustrates how to compute the portfolio VaR of a group of options, given the option inputs (stock price, strike price, risk-free rate, maturity, annualized volatilities, and dividend rate). The option delta is then computed using the MTCallDelta function. The delta measure is the instantaneous sensitivity of the option’s value to the stock price. Given the underlying stock price of the option, the quantity of options held in the portfolio, each option’s delta levels, and the daily volatility, we can compute the portfolio’s VaR measure. In addition, given a specific holding period (typically between 1 and 10 days) or risk horizon days and the percentile required (typically between 90% and 99.95%), we can compute the portfolio’s VaR for that holding period and percentile. Finally, the daily volatility is computed by dividing the annualized volatility by the square root of trading days per year.

Figure 3.10: Delta Options VaR with Known Options Delta Values

Figure 3.11: Delta Options VaR with Options Input Parameters

