File Name: Forecasting – Linear Interpolation
Location: Modeling Toolkit | Forecasting | Linear Interpolation and Modeling Toolkit | Yield Curve |Spline Interpolation and Extrapolation
Brief Description: Illustrates how to compute a linear and nonlinear interpolation and extrapolation of missing values in a time-series forecast model and for forecasting
Requirements: Modeling Toolkit, Risk Simulator
Modeling Toolkit Functions Used: MTInterpolationLinear, MTCubicSpline
Sometimes interest rates or any type of time-dependent rates may have missing values. For instance, the Treasury rates for Years 1, 2, and 3 exist, and then jump to Year 5, skipping Year 4. We can, using linear interpolation (i.e., we assume the rates during the missing periods are linearly related), determine and “fill in” or interpolate their values. This model illustrates how to use this function (Figure 84.1).
In contrast, the cubic spline polynomial interpolation and extrapolation model is used to “fill in the gaps” of missing values (interpolation) and forecasting outside of the known values (extrapolation) when the underlying structure is nonlinear. For example, we can apply this approach to spot yields and the term structure of interest rates whereby the model can be used to both interpolate missing data points within a time series of interest rates (as well as other macroeconomic variables such as inflation rates and commodity prices or market returns) and also used to extrapolate outside of the given or known range, useful for forecasting purposes. Figure 84.2 illustrates the cubic spline model.
The cubic spline extrapolation approach can be applied either by using the Modeling Toolkit function or Risk Simulator’s Cubic Spline module as seen in Figure 84.3. The example file using this module can be accessed through Risk Simulator | Examples | Advanced Forecasting Models and going to the Cubic Spline worksheet. Figure 84.4 shows the results of running the Cubic Spline module.
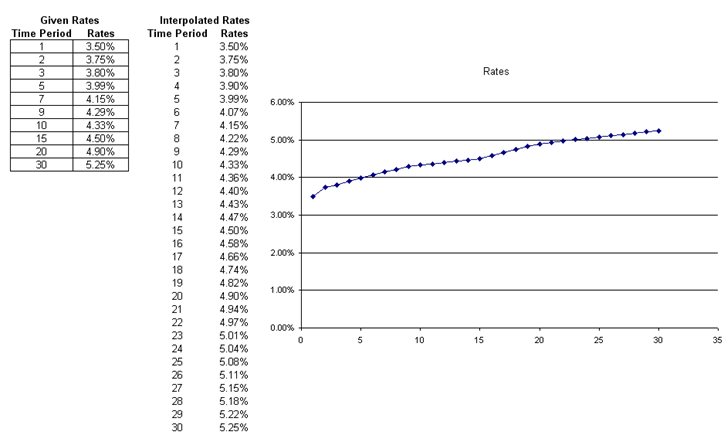
Figure 84.1: Interpolating missing values in a linear time series
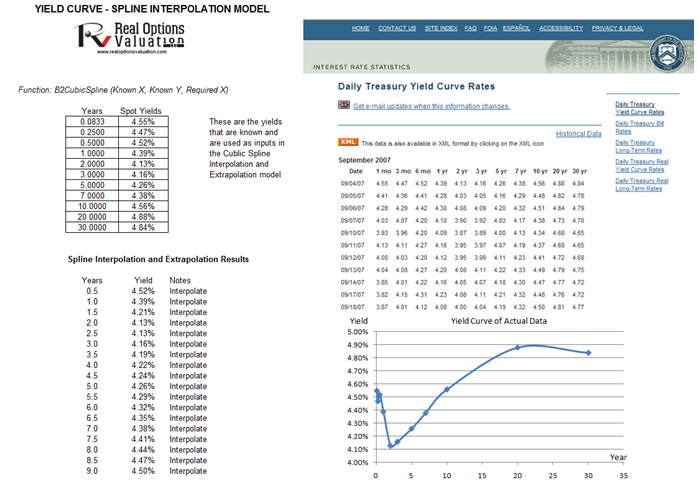
Figure 84.2 Interpolating missing values and forecast extrapolation in a nonlinear time series
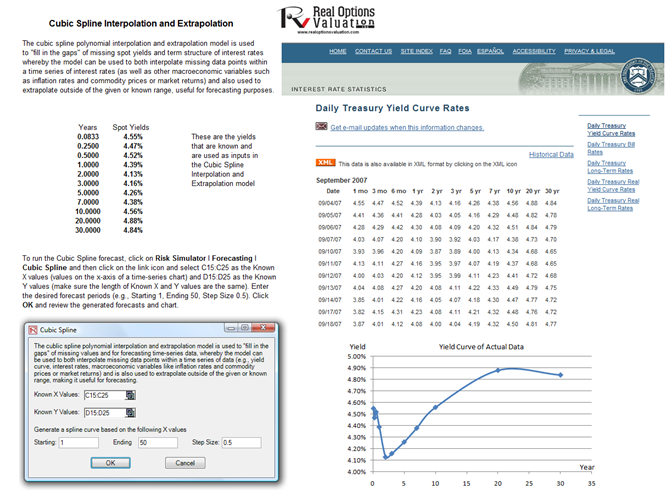
Figure 84.3 Cubic Spline module in Risk Simulator
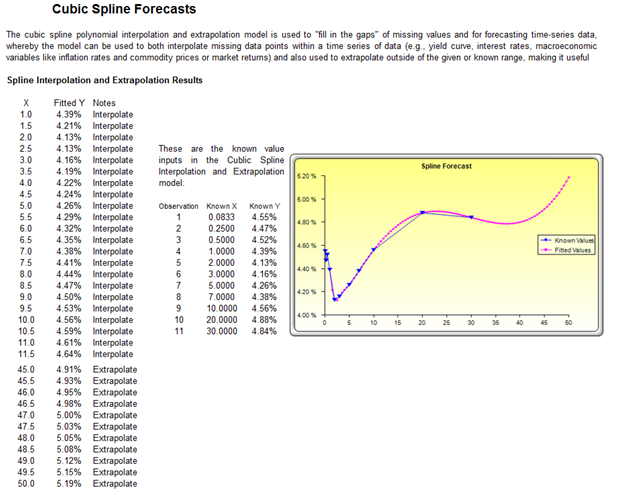
Figure 84.4 Cubic Spline results