Theory: Neural Network
The term Neural Network is often used to refer to a network or circuit of biological neurons, while modern usage of the term often also refers to artificial neural networks comprising artificial neurons, or nodes, recreated in a software environment. Such networks attempt to mimic the neurons in the human brain in ways of thinking and identifying patterns and, in our situation, identifying patterns for the purposes of forecasting time-series data. In Risk Simulator, the methodology is found inside the ROV BizStats module located at Risk Simulator | ROV BizStats | Neural Network as well as in Risk Simulator | Forecasting | Neural Network. Figure 11.23 shows the Neural Network forecast methodology results and Figure 11.24 charts the historical data and forecast data.
Procedure
- Click on Risk Simulator | Forecasting | Neural Network.
- Start by either manually entering data or pasting some data from the clipboard (e.g., select and copy some data from Excel, start this tool, and paste the data by clicking on the Paste button).
- Select if you wish to run a Linear or Nonlinear (Cosine, Hyperbolic, or Logistic) Neural Network model, enter in the desired number of Forecast Periods (e.g., 5), the number of hidden Layers in the Neural Network (e.g., 3), and the number of Testing Periods (e.g., 5).
- Click Run to execute the analysis and review the computed results and charts. You can also Copy the results and chart to the clipboard and paste them into another software application.
Notes
Note that the number of hidden layers in the network is an input parameter and will need to be calibrated with your data. Typically, the more complicated the data pattern, the higher the number of hidden layers you would need and the longer it would take to compute. It is recommended that you start at 3 layers. The testing period is simply the number of data points used in the final calibration of the Neural Network model, and we recommend using at least the same number of periods you wish to forecast as the testing period.
Theory: Combinatorial Fuzzy Logic
In contrast, the term fuzzy logic is derived from fuzzy set theory to deal with reasoning that is approximate rather than accurate––as opposed to crisp logic, where binary sets have binary logic, fuzzy logic variables may have a truth value that ranges between 0 and 1 and is not constrained to the two truth values of classic propositional logic. This fuzzy weighting schema is used together with a combinatorial method to yield time-series forecast results in Risk Simulator as illustrated in Figure 11.25 and is most applicable when applied to time-series data that has seasonality and trend. This methodology is found inside the ROV BizStats module in Risk Simulator, at Risk Simulator | ROV BizStats | Combinatorial Fuzzy Logic as well as in Risk Simulator | Forecasting | Combinatorial Fuzzy Logic.
Procedure
- Click on Risk Simulator | Forecasting | Combinatorial Fuzzy Logic.
- Start by either manually entering data or pasting some data from the clipboard (e.g., select and copy some data from Excel, start this tool, and paste the data by clicking on the Paste button).
- Select the variable you wish to run the analysis on from the drop-down list, and enter in the seasonality period (e.g., 4 for quarterly data, 12 for monthly data, etc.) and the desired number of Forecast Periods (e.g., 5).
- Click Run to execute the analysis and review the computed results and charts. You can also Copy the results and chart to the clipboard and paste them into another software application.
Notes
Note that neither neural networks nor fuzzy logic techniques have yet been established as valid and reliable methods in the business forecasting domain, on either a strategic, tactical, or operational level. Much research is still required in these advanced forecasting fields. Nonetheless, Risk Simulator provides the fundamentals of these two techniques for the purposes of running time-series forecasts. To build more robust models, we recommend that you do not use any of these techniques in isolation, but, rather, in combination with the other Risk Simulator forecasting methodologies. Finally, you need sufficient data points to run these analyses with any level of confidence.
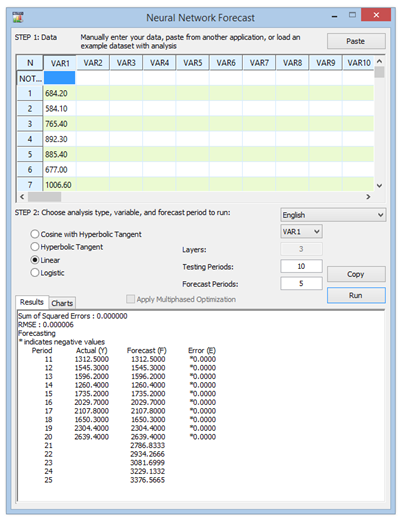
Figure 11.23: Neural Network Forecast Results
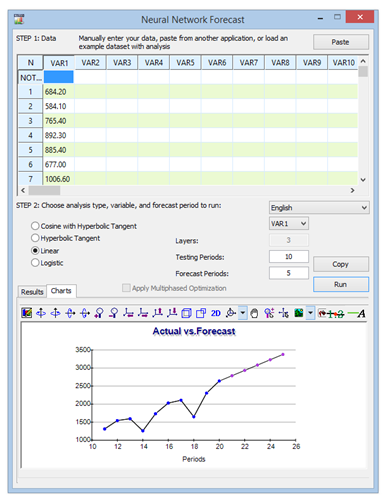
Figure 11.24: Neural Network Forecast Chart
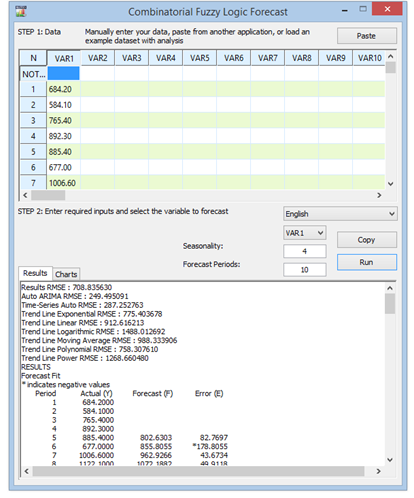
Figure 11.25: Combinatorial Fuzzy Logic Time-series Forecast