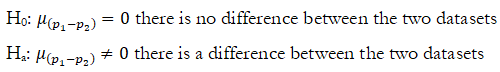
In certain situations, proportions (p) are used instead of raw values. In such situations, when there are two sets of data, the two proportions can be tested using the following hypotheses:
The z-test for two independent proportions is used, with the following specifications:
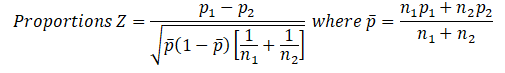
and where n1 and n2 are the sample sizes, p1 and p2 are the sample proportions, and ![]() is the pooled estimate of the population proportion as described above.
is the pooled estimate of the population proportion as described above.
This approach assumes that n1 p1, n1(1- p1), n2 p2, and n2(1- p2) should all be ≥ 5 and each n ≥ 30 so that the underlying binomial distribution (a proportion is equivalent to a binomial probability distribution with two outcomes) approaches the normal distribution, hence the ability to use the z-test.
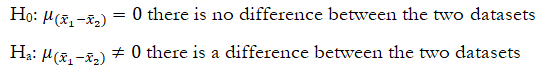
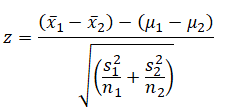
For the independent means test, the two samples’ means are tested using:
Example: Suppose a medical experiment includes a total of 3,806 male heart patients that are divided into two equal groups of 1,903 each (Figure 9.11). In this case, n1 = n2 = 1,903 , which satisfies the normal distribution requirements. A new heart drug was administered to the first group, and the number of mild coronary events was recorded for both groups. In the first group, 155 coronaries were recorded while there were 187 events in the second group. We, therefore, compute the proportions where p1 = 155/1903=0.0815 and p2 = 187/1903=0.0983. In this example, we use a one-tail hypothesis where H0 is μ(p1 -p2) ≥ 0 and Ha is μ(p1 -p2) < 0 indicating that the new drug group 1 has a lower proportion of coronary events and, hence, the drug has a statistically significant effect. Figure 9.11 shows the manual computations in Excel, and the one-tail p-value is 0.0350. This means we reject the null hypothesis at the α = 0.05 level, and we conclude that the drug does have a significant effect.
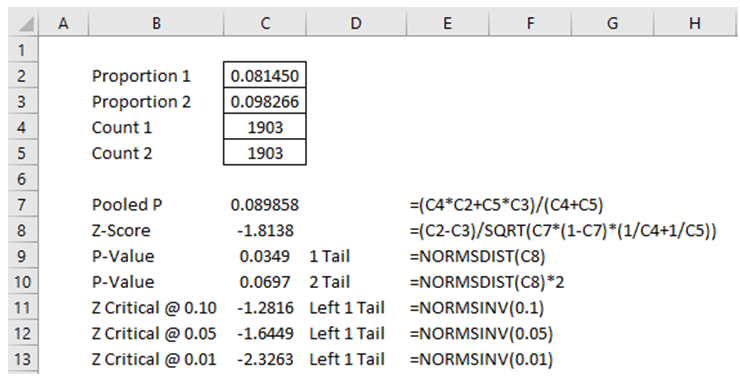
Figure 9.11: Z-Test for Proportions
Figure 9.12 illustrates the use of ROV BizStats using actual raw data where 1 represents a reduction and 0 represents no reduction. The proportions are automatically computed. The one-tail p-value shows 0.0349 and the same interpretation is applied as done in the manual computations.