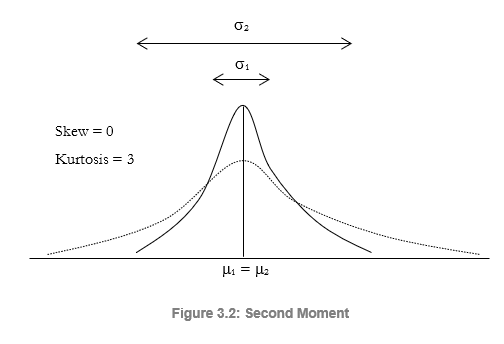
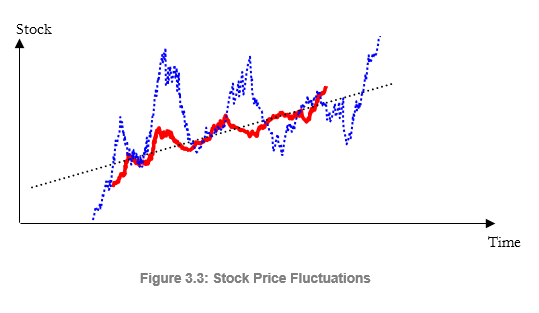
The second moment measures the spread of a distribution, which is a measure of risk. The spread or width of a distribution indicates the variability of a variable, that is, the potentiality that the variable can fall into different regions of the distribution—in other words, the potential scenarios of outcomes. Figure 3.2 illustrates two distributions with identical first moments (identical means) but very different second moments or risks. The visualization becomes clearer in Figure 3.3. As an example, suppose there are two stocks and the first stock’s movements (the solid line) with the smaller fluctuation is compared against the second stock’s movements (the dotted line) with a much higher price fluctuation. Clearly, an investor would view the stock with the wilder fluctuation as riskier because the outcomes of the riskier stock are relatively more unknown than the less risky stock. The vertical axis in Figure 3.3 measures the stock prices; thus, the riskier stock has a wider range of potential outcomes. This range is translated into a distribution’s width (the horizontal axis) in Figure 3.2, where the wider distribution represents the riskier asset. Hence, the width or spread of a distribution measures a variable’s risks.
Notice that in Figure 3.2, both distributions have identical first moments or central tendencies but clearly the distributions are very different. This difference in the distributional width is measurable. Mathematically and statistically, the width or risk of a variable can be measured through several different statistics, including the range, standard deviation (σ), variance, coefficient of variation, percentile, interquartile range, confidence interval, volatility, beta, Value at Risk, and others.
 Variance and Standard Deviation
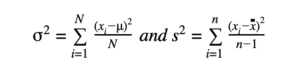
Variance and standard deviation are two common measures of the second moment. Variance is the average of the squared deviations about their means, in squared units:
Standard deviation is in original units and, thus, useful as a direct means of comparison of dispersion and variability measured in the same units:
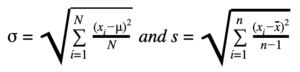
Although standard deviation and variances have many uses, those uses are limited because their measurements are in the same units and, hence, are considered absolute values of risk, uncertainty, or spread. Greek letters (μ, σ) and uppercase letters (N) represent the population whereas standard Latin alphabets and lowercase letters (s, n, x) represent the sample.
Coefficient of Variation
The coefficient of variation (CV) is unitless and measures relative variability. It thus allows the comparison of two datasets to see which has more variability without worrying about the units.
CV = s/ x̅ or CV = σ/μ
| Statistic | # in family |
Food expenditure ($) |
| x̅ | 3.23 | $110.5 |
| s | 1.34 | $25.25 |
Which has more variation, the number of family members or the food expenditure?
CV in family = 1.34/3.23 = 0.415
CV in expenditures = 25.25/110.25 = 0.229
The calculations show that there is more variation in the number of family members.