Brief Description: This chapter provides some examples of how Risk Simulator and Modeling Toolkit functions can be used inside Excel to create your own custom simulation assumptions
Requirements: Modeling Toolkit, Risk Simulator
This chapter reviews the use of Risk Simulator functions and Modeling Toolkit functions in Excel to set up and run Monte Carlo simulations. Specifically, these two sets of functions perform different tasks.
The Risk Simulator functions are used to manually set assumptions in your model (Figures 136.1 and 136.2) in lieu of using the Set Input Assumption icon. In contrast, the Modeling Toolkit functions can be used to customize a cell with any combinations of distributions, linking the assumption’s inputs to other cells which are also assumptions, and these can be used in conjunction with Risk Simulator (Figures 136.3, 136.4, and 136.5).
Risk Simulator Functions
Typically, to set up and run a simulation, you would first create a New Profile in Risk Simulator, and then enter your preferences at the relevant cells, Set Input Assumptions and Output Forecasts, prior to running a simulation. However, there is an alternative, that is, using RS Functions to set these assumptions. Figure 136.1 shows an example where cell A2 is first selected as the “control cell” and the RS Assumption function is called (click on the Insert Function or FX icon in Excel, select All Categories, and scroll down to the RS Assumption functions). The figure shows the RSAssumptionBeta function, where cell A1 is linked as the assumption cell, the cell’s default Value is set to 3 (this is a placeholder value, where instead of leaving the cell empty, it will show this value before a simulation is run), and a Variable Name can be set (this will become the Risk Simulator assumption name), as well as the relevant parameters (e.g., Alpha and Beta). Clicking on OK will set the Risk Simulator assumption in cell A1.
To make sure the assumption was set up correctly, you can select cell A1 and click on the Set Input Assumption icon (Figure 136.2). You can see that the relevant distribution was set, with the parameters and assumption name. At this point, a regular simulation using Risk Simulator can be run. If you also wish to obtain forecast charts, do not forget to first set output forecasts in your model prior to running the simulation.
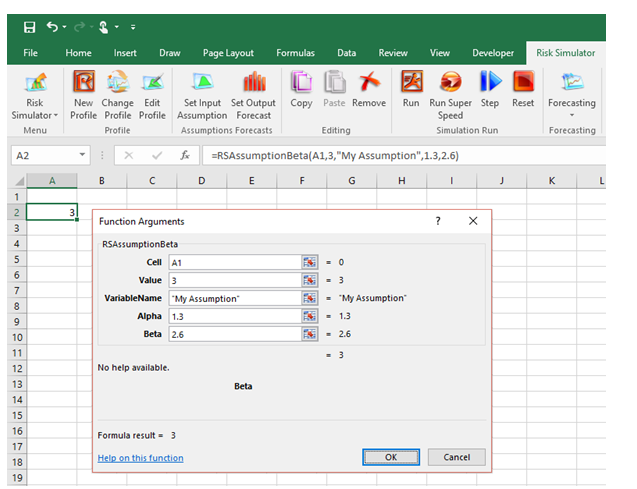
Figure 136.1: Using RS Functions to manually set assumptions
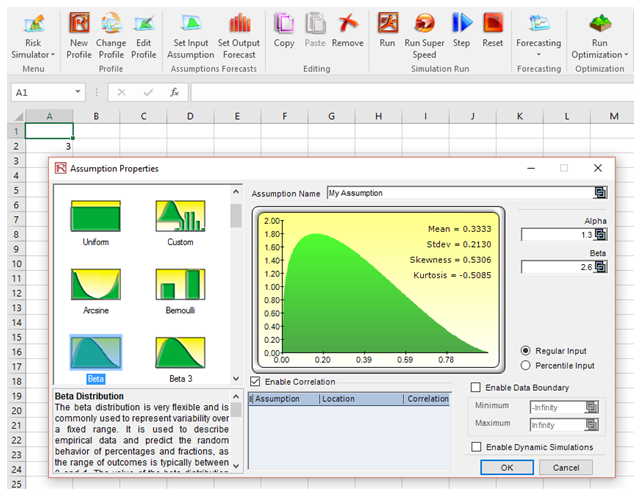
Figure 136.2: Checking the RS Assumption that was set
Modeling Toolkit Simulation Functions
There are over three dozen MTSimulate functions in Modeling Toolkit. Each function will simulate a specific probability distribution. For instance, Figure 136.3 shows the MTSimulateGamma function where a gamma distribution with Alpha = 2.3 and Beta = 4.2 is set in cell A1. The Random input in the function is a standard uniform distribution between 0 and 1. You can use Excel’s RAND() function (Figure 136.3) and you will need to manually hit F9 on the keyboard to manually simulate the RAND() function and, hence, generate the beta distribution. The problem with this approach is you will need to run each simulation trial manually, or write complex VBA codes to run multiple trials. The benefit is that you can control the function in VBA to incorporate any external databases or external data sources to be used in your model.
In contrast, Figure 136.4 shows a better and simpler approach that is the most commonly used method, where the MTSimulate function can be used in conjunction with Risk Simulator assumptions. Specifically, instead of using MTSimulateGamma(2.3, 4.2, RAND()), we now first set a new Risk Simulator Profile and then a new Risk Simulator Assumption in cell B1 with a Uniform distribution with Min = 0 and Max = 1. You can further add a seed value to the Risk Simulator profile such that the results will be replicated each time the simulation is rerun. By embedding Risk Simulator assumptions and seed values, we can now automate the model (i.e., thousands of simulation trials can be run at once by clicking on the Risk Simulator Run icon) and the results will be replicated each time.
You can also embed additional MT simulation functions within a function, link the function to other cells, and make the input assumptions of a function to be the output of another function, and so forth. As an example, Figure 136.5 shows how you can use the following simple function to simulate a normal distribution with a mean of 10 and a standard deviation of 2 in a specific Excel cell B4:
=MTSimulateNormal(10,2,RAND()).
Similarly, instead of setting the input parameters (mean and standard deviation) as static inputs, you can set them as dynamic outputs of another simulation (cell B7):
=MTSimulateNormal(MTSimulateGamma(1.2,1.5,RAND()),MTSimulateTriangular(0.5,0.8,1.2,RAND()),RAND()).
Of course, you can also link the three RAND() functions to three separate cells in Excel with Risk Simulator assumptions set (i.e., Uniform (0,1) in cells B9 to B11) and add a seed value to the Risk Simulator settings such that the results will be replicated each time.
Finally, cell B7 can be set as a forecast using Risk Simulator such that when the simulation is run, you will obtain the Risk Simulator forecast chart (see Figure 136.5).
Risk Simulator Results Function
Figure 136.6 shows a final function in Risk Simulator, called RSForecastStatistic. To make this function work, you need to first set a simulation profile, input assumption, and output forecasts, and then run a simulation. Once the simulation is done, set up the RSForecastStatistic as illustrated in Figure 136.6. It will call the simulation results and put them into Excel cells. Every time a simulation is run, these cells will update accordingly. Be aware that you might get an error message if there are no output forecasts set or no simulations have yet been run.
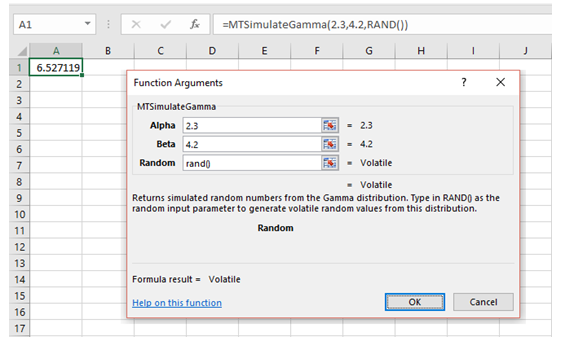
Figure 136.3: Using Modeling Toolkit MT Functions to set simulation assumptions
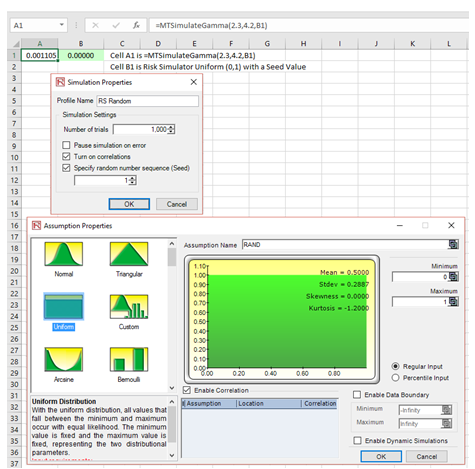
Figure 136.4: Mixing RS and MT capabilities to customize simulations
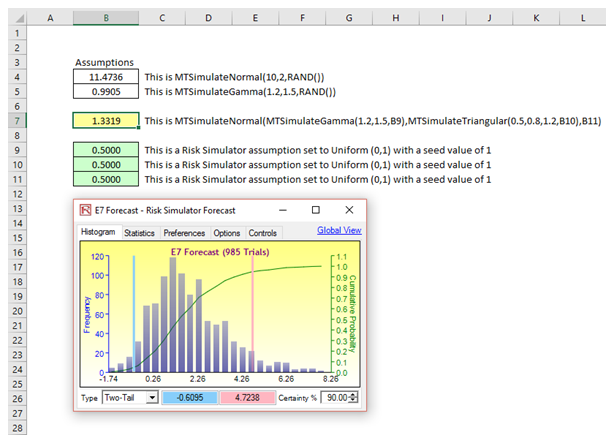
Figure 136.5: Embedded MT simulation with Risk Simulator charting and seed value
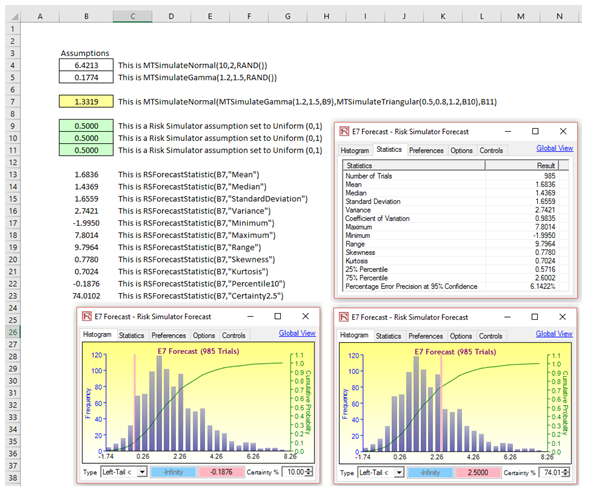
Figure 136.6: Risk Simulator’s RSForecast function