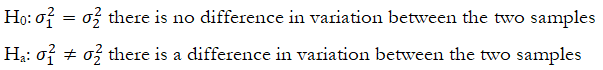
On occasion, we may need to compare the variances of two independent sample sets. For instance, when comparing the mean time between failure (MTBF) of two different equipment setups and measuring the amount of variation that exists, we can determine if the variation of MTBF of the old or new equipment is greater. The F-test is used in this instance, where we test the following hypotheses:
The test employs the following specifications:
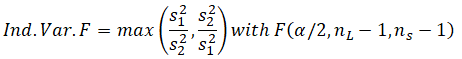
where n – 1 values are the degrees of freedom, nL is the sample with the larger variance, and nS is the sample with the smaller variance.
Example: Suppose two equipment sets were each implemented in seven different locations and their respective MTBF in months were collected. As shown in Figure 9.9, the sample standard deviations were calculated as 0.7091 and 0.5350 for these two equipment sets (see figure below). The F statistic is computed as 1.7571 with a corresponding p-value of 0.2552 (one-tail) and 0.5104 (two-tail), which means we do not reject the null hypothesis and conclude that there is no statistically significant difference in variation of the MTBF. Figure 9.10 shows how to implement the computation in ROV BizStats.
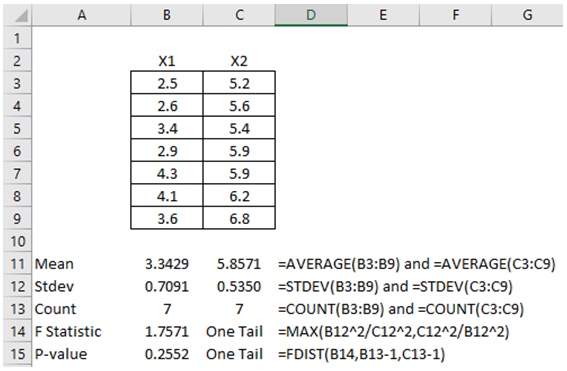
Figure 9.9: F-Test for Variances
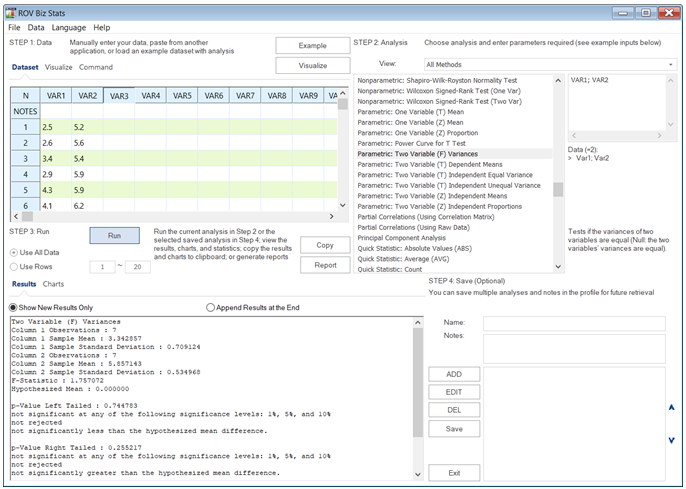
Figure 9.10: F-Test for Variances in ROV BizStats
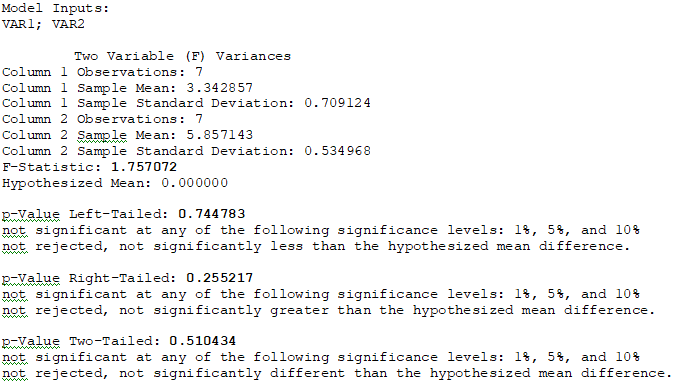
Figure 9.10: F-Test for Variances in ROV BizStats
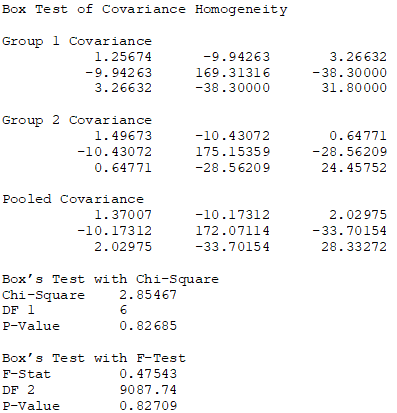
A related test is the Box Test of Covariance Homogeneity, which extends the F-test for variances. The latter tests two variables at once for similarities between their variances, whereas the former looks at multiple variables in two distinct groups. The null hypothesis is such that the covariance matrix of the first group is the same as the second group. For example, the results below are based on running the Box test where the first group has three variables, and the second group also has three variables. The Chi-Square test and F-test can be applied in this example. Both p-values for these tests indicate we cannot reject the null hypothesis, indicating that the covariances are similar between the two groups of variables. This test is also useful when looking at the consistency of data variations between two groups.
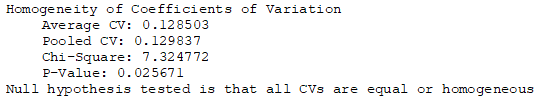
Another related test is the Coefficient of Variation Homogeneity (CV Homogeneity) test, where instead of looking at variances (F-test) or covariance matrices (Box Test), we can test the similarities among coefficients of variation. Recall that CV is a relative measure of risk, spread, and uncertainty of a distribution. It is unitless and can be used to compare the dispersion among distributions with differing units (e.g., we can compare kilograms with meters, millions of dollars against multibillion-dollar investment risks). Hence, testing the homogeneity of CV is sometimes important. The following is an example set of results from BizStats, where the CV Homogeneity tests the null hypothesis that the CVs are equal across multiple variables. A low p-value indicates we can reject the null hypothesis and conclude that the CVs are not similar among the test variables.