File Name: Value at Risk – Optimized and Simulated Portfolio VaR
Location: Modeling Toolkit | Value at Risk | Optimized and Simulated Portfolio VaR
Brief Description: Computes the Value at Risk (VaR) of a portfolio of assets and uses Monte Carlo simulation to perform a historical simulation to determine the tail-end confidence interval for determining VaR
Requirements: Modeling Toolkit, Risk Simulator
This model uses Monte Carlo simulation and optimization routines in Risk Simulator to minimize the Value at Risk (VaR) of a portfolio of assets (Figure 156.1).
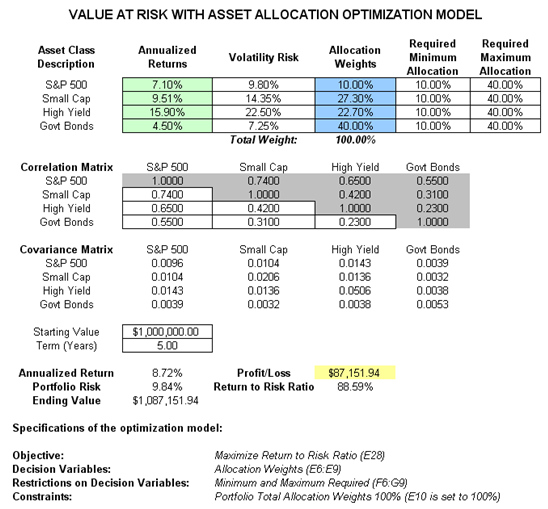
Figure 156.1: Computing Value at Risk (VaR) with simulation
First, simulation is used to determine the 90% left-tail VaR. This means that there is a 10% chance that losses will exceed this VaR for a specified holding period. With an equal allocation of 25% across the four asset classes, the VaR is determined using simulation (Figure 156.2). The annualized returns are uncertain and hence simulated. The VaR is then read off the forecast chart. Then optimization is run to find the best portfolio subject to the 100% total allocation across the four projects that will maximize the portfolio’s bang for the buck (returns to risk ratio). The resulting optimized portfolio is then simulated once again, and the new VaR is obtained (Figure 156.3). The VaR of this optimized portfolio is a lot less than the non-optimized portfolio.
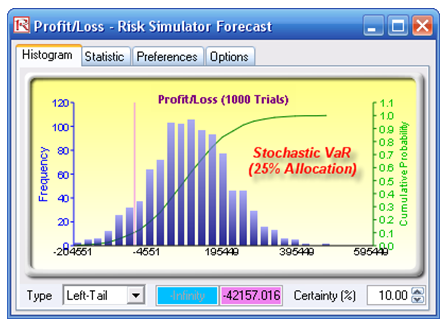
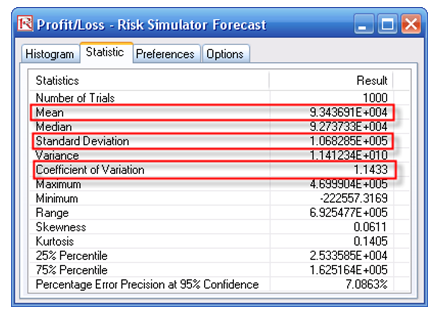
Figure 156.2: Non-optimized Value at Risk
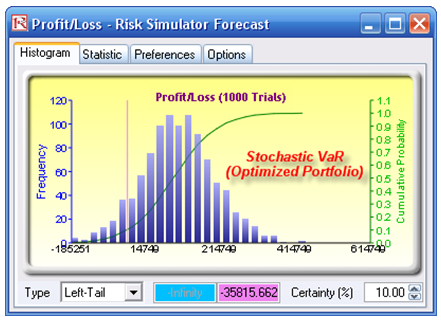
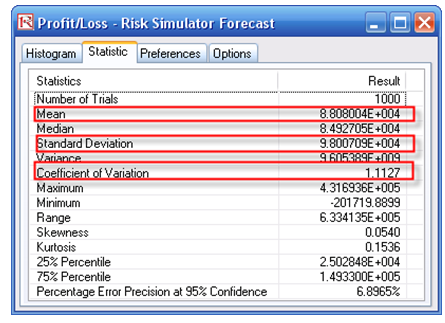
Figure 156.3: Optimal portfolio’s Value at Risk through optimization and simulation