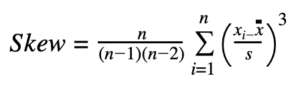
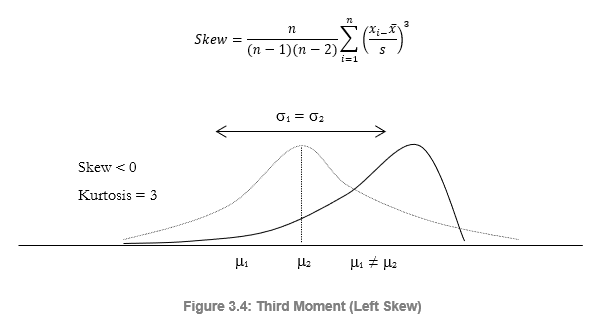
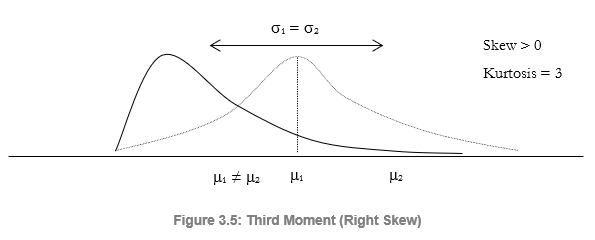
The third moment measures a distribution’s skewness, that is, how the distribution is pulled to one side or the other. Figure 3.4 illustrates a negative or left skew (the tail of the distribution points to the left) and Figure 3.5 illustrates a positive or right skew (the tail of the distribution points to the right). The mean is always skewed towards the tail of the distribution, while the median remains constant. Another way of seeing this is that the mean moves but the standard deviation, variance, or width may still remain constant. If the third moment is not considered, then looking only at the expected returns (mean) and risk (standard deviation), a positively skewed project might be incorrectly chosen! For example, if the horizontal axis represents the net revenues of a project, then clearly, a left or negatively skewed distribution might be preferred as there is a higher probability of greater returns (Figure 3.4) as compared to a higher probability for lower-level returns (Figure 3.5). Thus, in a skewed distribution, the median is a better measure of returns, as the medians for both Figures 3.4 and 3.5 are identical, risks are identical, and, hence, a project with a negatively skewed distribution of net profits is a better choice. Failure to account for a project’s distributional skewness may mean that the incorrect project may be chosen (e.g., two projects may have identical first and second moments, that is, they both have identical returns and risk profiles, but their distributional skews may be very different).