- Related AI/ML Methods: Custom Fit Model
- Related Traditional Methods: Basic Econometric Model, Multiple Regression
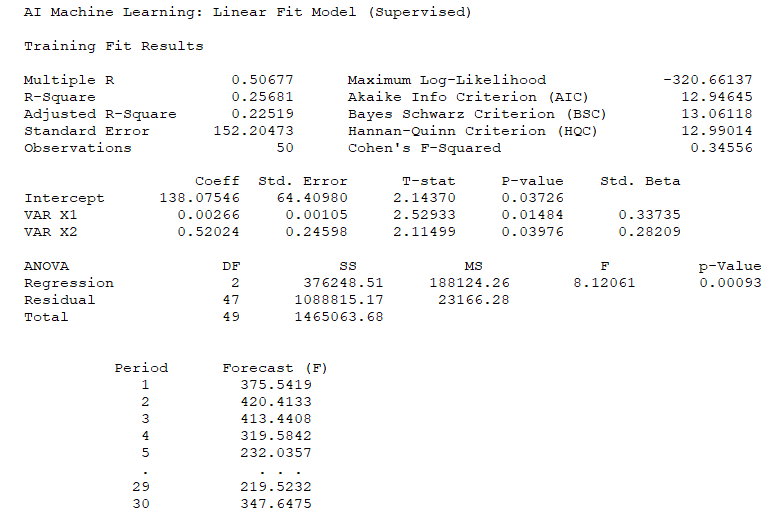
Multivariate linear regression is used to model the relationship structure and characteristics of a certain dependent variable as it depends on other independent exogenous variables. Using the modeled relationship, we can forecast the future values of the dependent variable. The accuracy and goodness of fit for this model can also be determined. Linear and nonlinear models can be fitted in the multiple regression analysis. Similar to the custom fit model, running the Linear Fit model is like regular regression analysis except that we first train the algorithm using the training dependent and training independent variables, which will identify the optimized parameters to use on the testing dataset. Figure 9.71 illustrates the AI Machine Learning Linear Fit supervised model. For more detailed explanations of regression models, see Linear and Nonlinear Multivariate Regression in Chapter 9 and Regression Analysis in Chapter 12, as well as the associated sections on the pitfalls of regression modeling.
Similar to the custom fit model explained previously, we divide the dataset into a training set and a testing set. In Figure 9.71, the example used VAR373 as the training dependent variable and VAR374; VAR375 as the training independent variables, making this a form of supervised learning. Using these training data, the model is calibrated, and the parameters estimated. Then, the testing independent variables are entered, such as VAR380; VAR381. Please note that there can only be a single dependent variable versus one or more independent variables. Also, the number of independent variables in the testing set and training set must match.
The algorithm also allows you to optionally enter known testing set dependent values. Sometimes these are known and sometimes they are unknown and are to be forecasted. If the values are unknown, simply leave the input empty or enter a 0 in the input if you wish to enter the next input, which is the forecast results save location in the data grid. Figure 9.71 shows these last two inputs are treated as optional and left empty.
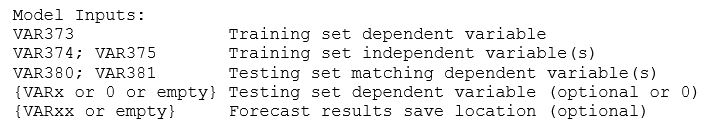
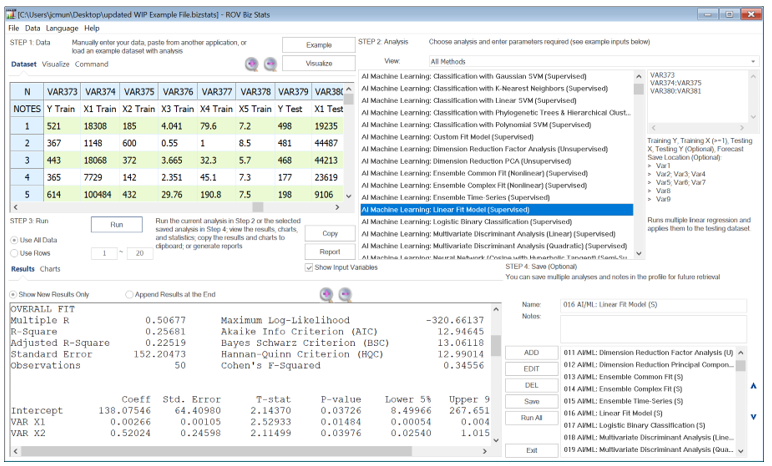
Figure 9.71: AI/ML Linear Fit Model (Supervised)
The results interpretation would be similar to the multiple linear regression. The goodness-of-fit results and fitted parameter estimations pertain to the training dataset, whereas the forecast values are based on the testing dataset when applied to these fitted parameters. Sometimes, you may wish to hold some data back from the training dataset and apply it to the testing dataset to test the accuracy of the model and its ability to forecast, as well as to view the forecast errors. In other words, the optional testing set’s dependent variable can be used and because these known values are applied, forecast errors can also be generated as a result. For example, the VARx value above can be set to VAR379.