Using PEAT’s Project Management module, we replicate Figure 3.1’s complex model as shown in Figure 3.4. The same approach was used to create the model as previously discussed in Chapter 2. Further, the input assumptions shown in Figures 3.2 and 3.3 have been entered into PEAT (Figures 3.5 and 3.6).
Monte Carlo risk simulation was run, and the critical path probabilities are seen in Figure 3.6 at the bottom of the screen. There are only two probable critical paths, 1–5, 7, 12, 14–16, 18–24 and 1–4, 8–12, 14–16, 18–24. This indicates that the two critical paths are highly similar, except for Tasks 5, 7, and 12 versus 8–12. Further, we see in Figure 3.6 that the total most likely schedule is 408 weeks, and the total fixed costs are $24, $36, $72, with the total cost being $143. These are the exact results from our manual computations in Figures 3.2 and 3.3.
Figure 3.7 shows the main critical path (the one with the highest probability of occurrence), and Figure 3.8 shows the simulated schedule has a mean of 458.42 weeks with a 99th percentile value at 519.10 weeks. This means that using a single-point estimate of 408 weeks would yield a completely incorrect assessment of the actual schedule risk. On average, there will be a 50.42-week schedule slip. In the absolute worst-case scenario, we are still sure that, 99% of the time, the project will complete in 519.0 weeks.
Figure 3.9 shows the simulated cost, where the mean is $162.86M with a 90% confidence interval that cost will be between $151.57M and $173.91M. This means that there is a 5% chance cost will be below $151.57M and a 5% chance it will exceed $173.91M. This is a far cry from the $143M single-point estimate. In this case, there will be an average $19.86M budget overrun. If simulation was not applied, the project would be both significantly over budget and very late, based on projections.
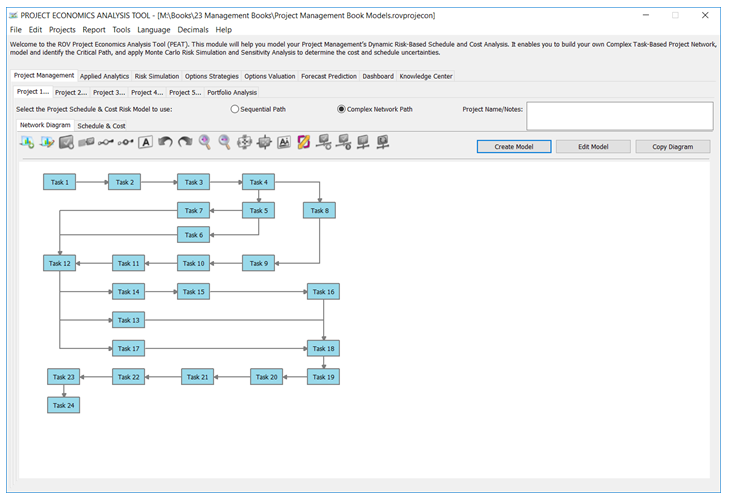
Figure 3.4: PEAT Network Task Diagram
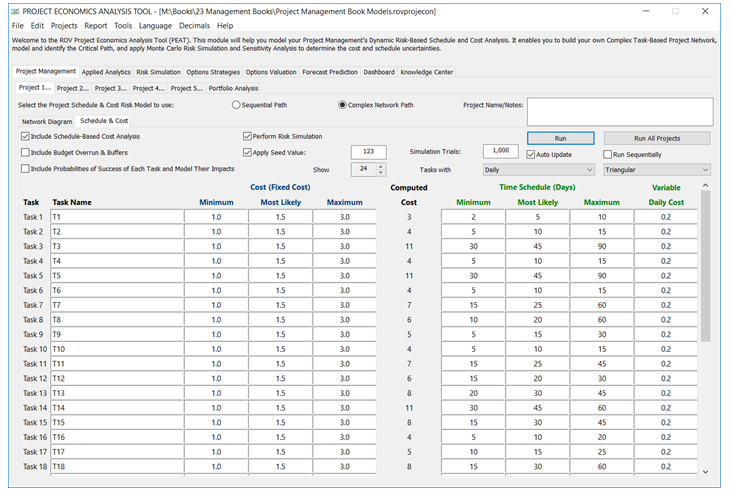
Figure 3.5: Fixed Cost, Schedule, and Variable Cost Inputs
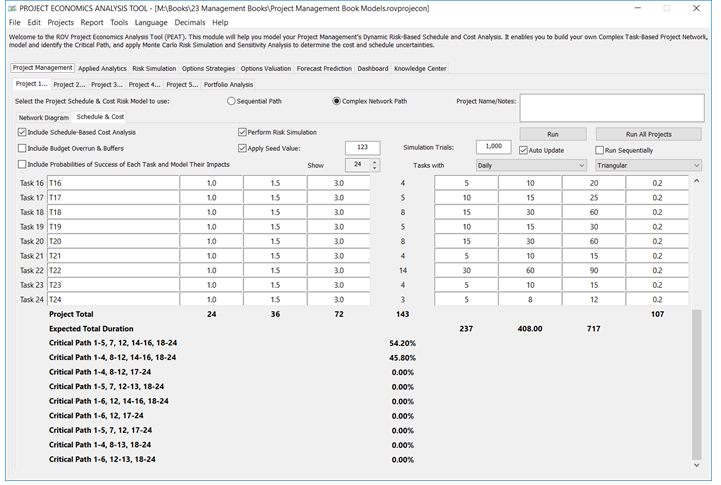
Figure 3.6: Simulated Critical Paths
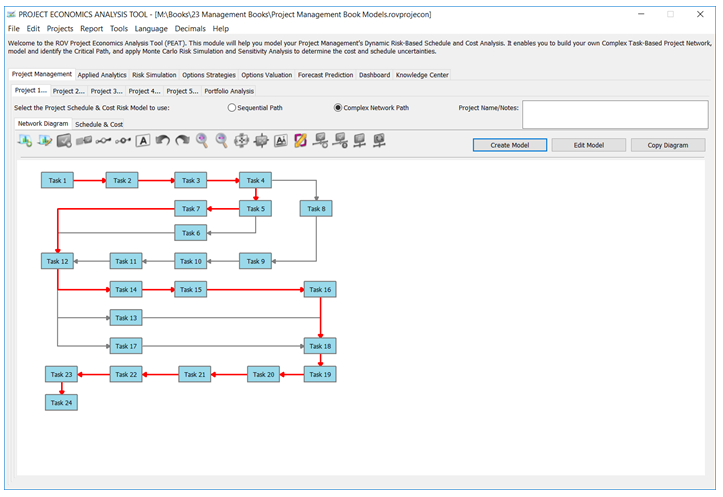
Figure 3.7: Main Critical Path
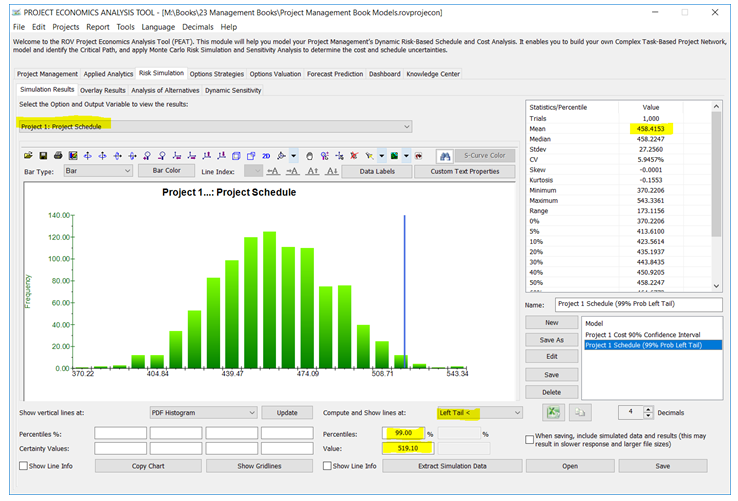
Figure 3.8: Simulated Schedule Risk Profile
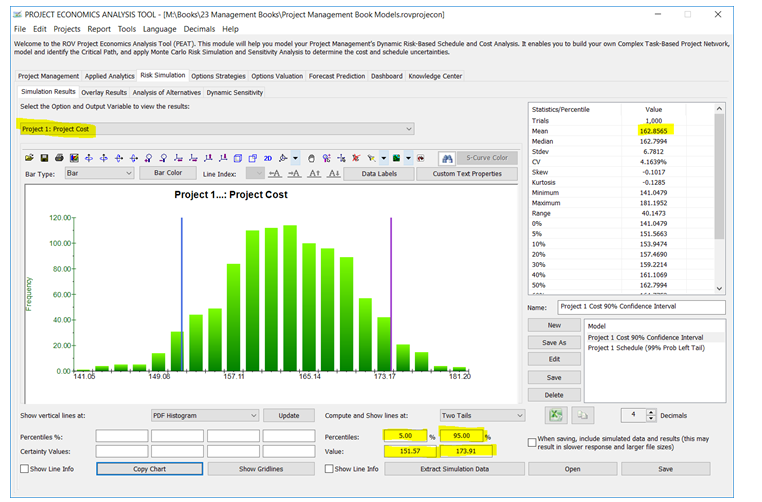
Figure 3.9: Simulated Cost Risk Profile