File Name: Yield Curve – Term Structure of Volatility
Location: Modeling Toolkit | Yield Curve | Term Structure of Volatility
Brief Description: Illustrates the term structure of volatilities of interest rates
Requirements: Modeling Toolkit, Risk Simulator
Not only are interest rates themselves critical but their underlying volatility is also key. Interest rate volatilities change over time and, depending on the maturity, also are different during the same time period. Are shorter-term rates more volatile or long-term rates more volatile? It depends on the liquidity preference, trading market depth, economic outlook, and so forth. Using multiple years of historical data, spot interest rates are analyzed and their respective volatilities are tabulated in the model, and the results are shown in Figures 167.1 and 167.2.
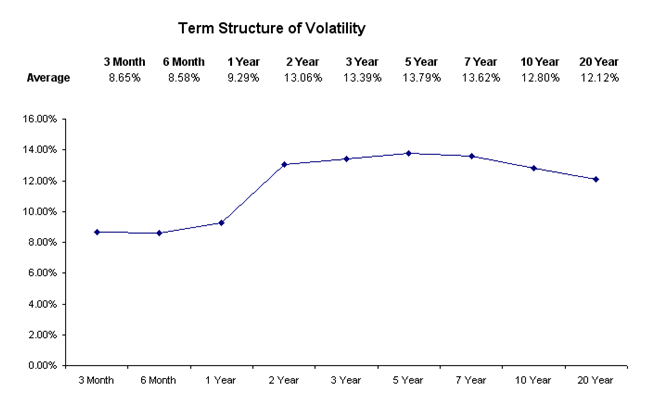
Figure 167.1: Term structure of average volatility
Notice that longer-term yields tend to have smaller volatilities than shorter-term, more liquid, and highly traded instruments (Figure 167.2), such as one-year Treasury bills.
Note that in the Bond Options models, we use the BDT lattices to model the term structure of interest rates accounting for different spot rates and local volatilities over time. In contrast, this chapter uses actual empirically-based models to determine the historical term structure of interest rates and their local volatilities.
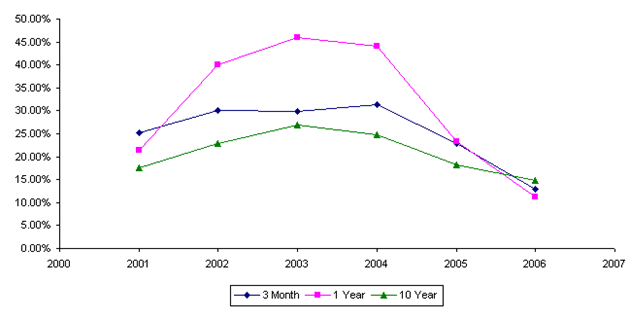
Figure 167.2: Term structure of volatility by maturity