File Name: Debt Analysis – Debt Sensitivity Models
Location: Modeling Toolkit | Debt Analysis | Debt Sensitivity Models
Brief Description: Models a debt instrument’s sensitivity to interest rates using duration and convexity methods, while applying various discrete and continuous discounting measures
Requirements: Modeling Toolkit, Risk Simulator
Modeling Toolkit Functions Used: MTBondPriceDiscrete, MTBondPriceContinuous, MTBondYTMDiscrete, MTBondYTMContinuous, MTDurationDiscrete, MTDurationContinuous, MTMacaulayDuration, MTModifiedDuration, MTConvexityYTMDiscrete, MTConvexityYTMContinuous, MTConvexityDiscrete, MTConvexityContinuous, MTBondPriceChange
This model (Figure 19.1) is used to determine a debt’s interest sensitivity while accounting for a series of cash flow payments from the debt over time (e.g., a bond’s coupon payments and the final face value repayment) as interest rates are changing over time. The debt’s price, yield to maturity, duration, and convexities are computed.
Duration and convexity are sensitivity measures that describe exposure to parallel shifts in the spot interest rate yield curve, applicable to individual fixed income instruments or entire fixed income portfolios. These sensitivities cannot warn of exposure to more complex movements in the spot curve, including tilts and bends, only parallel shifts. The idea behind duration is simple. Suppose a portfolio has a duration measure of 2.5 years. This means that the portfolio’s value will decline about 2.5% for each 1% increase in interest rates—or rise about 2.5% for each 1% decrease in interest rates. Typically, a bond’s duration is positive, but exotic instruments, such as mortgage-backed securities, may have negative durations, including portfolios that short fixed income instruments or portfolios that pay fixed for floating interest payments on an interest rate swap. Inverse floaters tend to have large positive durations. Their values change significantly for small changes in rates. Highly leveraged fixed income portfolios tend to have very large (positive or negative) durations.
In contrast, convexity summarizes the second-most significant piece of information, or the nonlinear curvature of the yield curve, whereas duration measures the linear or first-approximation sensitivity. Duration and convexity have traditionally been used as tools for immunization or asset-liability management. To avoid exposure to parallel spot curve shifts, an organization (e.g., an insurance company or defined benefit pension plan) with significant fixed income exposures might perform duration matching by structuring assets so that their duration matches the duration of its liabilities so the two offset each other. Even more effective (but less frequently practical) is duration-convexity matching, in which assets are structured so that durations and convexities match.
The standard financial computations for duration, modified duration, and convexity are shown below:
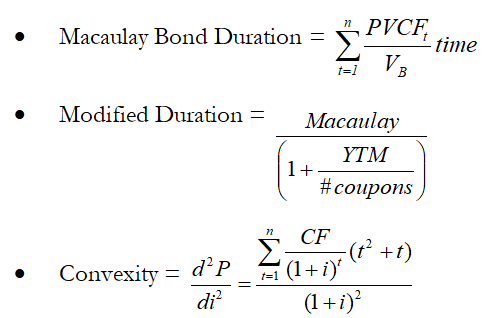
where PVCF is the present value of cash flows (CF) for individual periods, V is the value of the bond, time (t) is the time period at which the cash flow occurs, YTM is the bond’s yield to maturity (internal rate of return on the bond, or identical interest yield by holding the bond to maturity, computed based on the value of the bond at time zero), and i is the interest rate used to discount and price the bond.
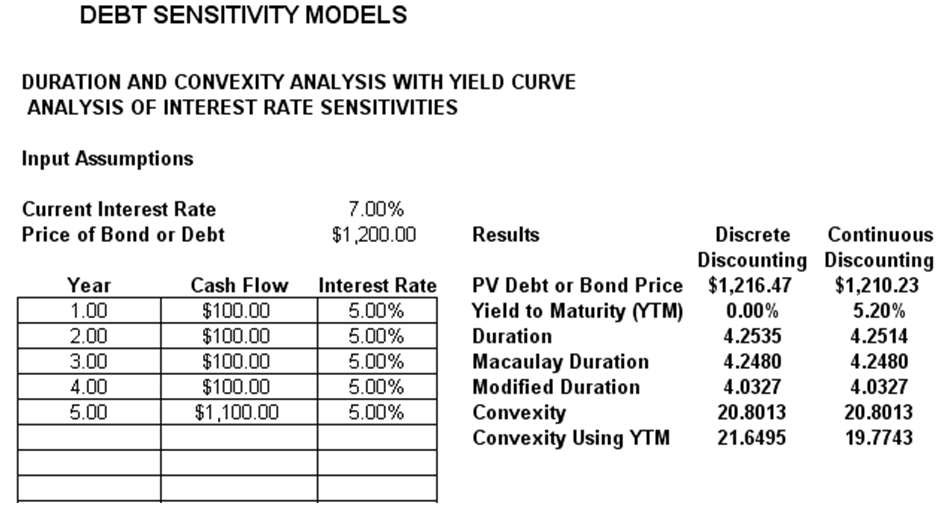
Figure 19.1: Debt sensitivity models