As discussed, nonparametric techniques make no assumptions about the specific shape or distribution from which the sample is drawn. This lack of assumptions is different from the other hypotheses tests such as ANOVA or t-tests (parametric tests) where the sample is assumed to be drawn from a population that is normally or approximately normally distributed. If normality is assumed, the power of the test is higher due to this normality restriction. However, if flexibility on distributional requirements is needed, then nonparametric techniques are superior.
The nonparametric Wilcoxon Signed-Rank Test (WSRT) for Single Variable looks at whether a sample dataset could have been randomly drawn from a particular population whose median is being hypothesized. The corresponding parametric test is the one-sample t-test, which should be used if the underlying population is assumed to be normal, providing a higher power on the test. In this single variable test, the following hypotheses are tested:
H0: Population Median = m
Ha: Population Median ≠ m
Of course, the null hypothesis can take the standard equality signs of =, ≥, or ≤, and m can be any hypothesized value to test. The alternate hypothesis will have the appropriate complementary sign of ≠, <, or >.
The WSRT uses a W-statistic, and its corresponding critical values are usually provided in a statistics table (these will be automatically calculated in a statistics software package such as ROV BizStats). The first step in calculating W is to take the difference ![]() All d = 0 values are ignored. Then, these
All d = 0 values are ignored. Then, these ![]() values are ranked from smallest (rank of 1) to largest. All tied ranks are assigned their average values. For all ranks that have a positive value or where
values are ranked from smallest (rank of 1) to largest. All tied ranks are assigned their average values. For all ranks that have a positive value or where ![]() we sum all these positive ranks to obtain the W, that is,
we sum all these positive ranks to obtain the W, that is, ![]()
Figure 9.33 shows an example of the WSRT for a single variable. The calculated W statistic is 13, and the two-tailed critical limits at a 0.05 significance are 9 and 46. The W falls within these critical limits, which means we fail to reject the null hypothesis and conclude that the population median is statistically not different than the hypothesized median (in this example it is set as 40 in ROV BizStats, as seen in Figure 9.33).
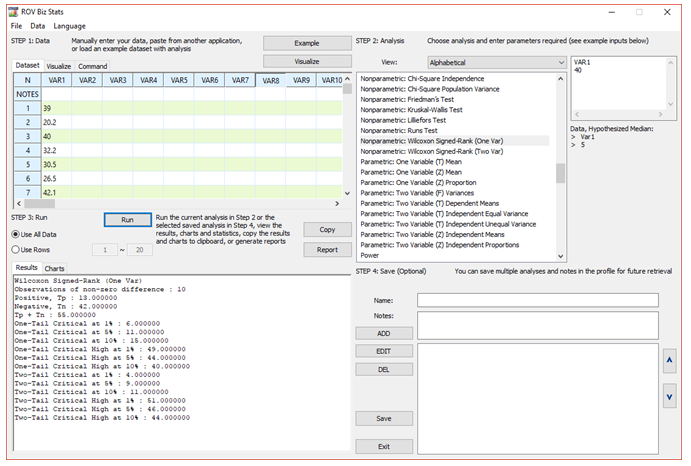
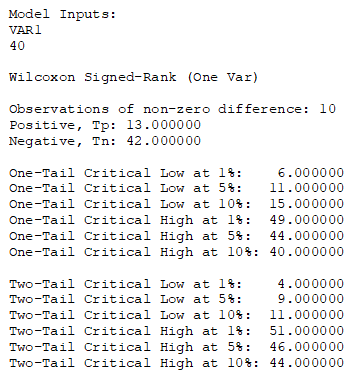
Figure 9.33: Wilcoxon Signed-Rank Test for One Variable
In contrast, the Nonparametric WSRT for Paired Variables looks at whether the medians of the differences between the two paired variables are equal. This test is specifically formulated for testing the same or similar samples before and after an event (e.g., measurements taken before a medical treatment are compared against those measurements taken after the treatment to see if there is a difference). The corresponding parametric test is the two-sample t-test with dependent means, which should be used if the underlying population is assumed to be normal, providing a higher power on the test. In this paired variable test, the following hypotheses are tested: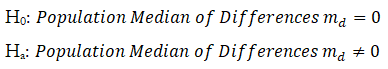
The approach is similar to the single variable WSRT with the exception that the difference d is computed as ![]()
where x and y are the two variables being tested. Figure 9.34 shows the WSRT for two variables. The first variable’s median is 102 compared to 136 for the second variable. The calculated W is 44.5 (denoted W1) with a hypothesized difference of 0. Using a 0.10 significance level vs. the two-tailed p-value of 0.07, we reject the null hypothesis and conclude that the differences of x and y medians are statistically significant.
In addition, the Nonparametric Mann–Whitney Test for two independent samples is related to the Wilcoxon Signed-Rank Test and is the nonparametric equivalent of the Two-Sample T-Test for Independent Variables. Similarly, the null hypothesis tested is that there is zero difference between the two variables.
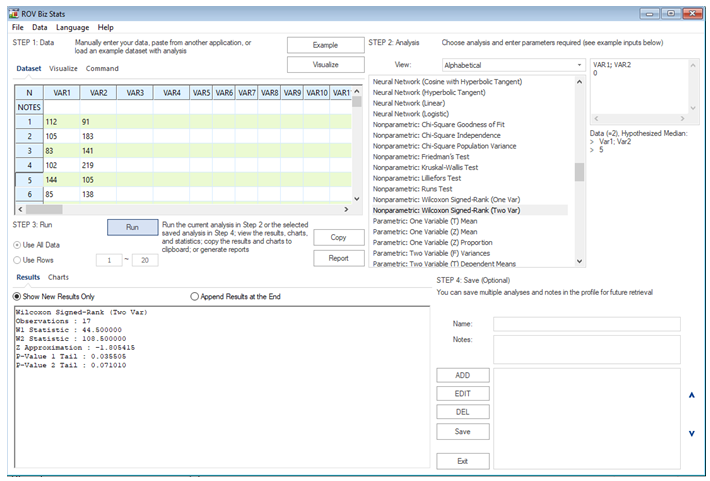
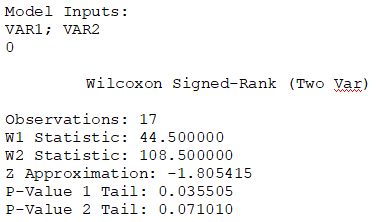
Figure 9.34: Wilcoxon Signed-Rank Test for Two Variables