Another extension to multiple regression analysis is the Structural Equation Model (SEM), which uses the Partial Least Squares (PLS) method. SEM is typically used to solve path-dependent structures such as the one illustrated in Figure 9.44. Suppose that there are five variables in your research, where the final dependent variable is technology acceptance (VAR5). We are trying to determine what drives and predicts the level of technology acceptance in different organizations. If we collected data on the corporate culture of the various organizations (VAR1) using a Likert scale in terms of openness to new technology, we can run a simple bivariate regression. However, we also understand from organizational behavior theory and decision theory that other intervening variables can also contribute to an organization’s acceptance of new technology, such as what types of decisions are relegated to technology, that is, the decision criticality (VAR2) and whether new artificial intelligence (AI) technology is used or more traditional technology is used (VAR3). For example, letting a smart AI computer system make frequent orders of paper clips is a lot less critical than allowing AI full and complete access to the nation’s nuclear arsenal. Mistakes made on the former have little consequence compared to the latter. However, we also know from technology acceptance theory that there are other latent and hidden effects that drive technology trust (VAR4). If a technology is not trusted, then the technology is probably not going to be accepted for use in the organization. Technology trust might include whether the AI technology has transparent algorithms or comes as a black box.
In such a research paradigm, one might be inclined to simply run the first four independent variables on the fifth dependent variable. That would be a major mistake and the results will be erroneous at best, because VAR2, VAR3, and VAR4 are endogenous. That is, based on various theories, we know that the type of organization drives the types of decision criticality (a local office-supplies store versus the U.S. Department of Defense, VAR1 drives VAR2), the type of advanced AI technology employed (paperclip reordering system has rudimentary code versus national cybersecurity defense against state-sponsored actors that requires much more sophisticated AI technology, VAR1 drives VAR3), and so forth. In addition, the level of decision criticality drives whether AI is needed (VAR2 drives VAR3). Whether AI is applied will drive trust in the new technology (VAR3 drives VAR4) and then acceptance. Figure 9.44 shows the tangled web known as a path model. A simple multiple regression analysis cannot be used. Instead, partial least squares or sequential regression models will need to be applied. The SEM approach is used to handle such complex path models.
In typical path models, the pathways move in a single direction, where one or multiple paths can originate from a box and one or many paths can recombine into a box, and the pathways all end at the main dependent model (in this example, that would be VAR5). The direct effects on VAR5 are pathways C, F, I, and J, from the four independent variables. However, these variables also have indirect effects (e.g., VAR3 has indirect impacts on VAR5 through path HJ; VAR2 has indirect effects on VAR5 through paths EJ, GI, and GHJ; and VAR1 has indirect impacts on VAR5 through paths AEJ, AF, AGI, AGHJ, BJ, DHJ, and DI). Notice that VAR4 does not have any indirect effects on VAR5, only a single direct impact path. The summation of the direct and indirect effects equals the total effects.
Due to the existence of endogenous variables (the tangled web where an independent variable can also be a dependent variable), the regular regression coefficients would not mean much as these would change depending on the combinations of variables modeled. Therefore, in path models, we use the Standardized Beta coefficients instead. Instead of a unitary impact of the independent variable on the dependent variable, these standardized beta estimates look at the movement of one standard deviation of the independent variable on the number of beta standard deviations of the dependent variable. These are the numerical values in Figure 9.44. You can also add in p-values (typically typeset in a smaller font in parenthesis) to show if a certain path is statistically significant or not. The variables denoted as D are the disturbances or errors in the model and are typically computed as ![]() Figure 9.45 shows the BizStats procedure for running an SEM PLS model and the model results. Pay close attention to how the SEM inputs are entered in BizStats in Figure 9.45. Look for the bold letters beside the results to identify where they are along the SEM path model. As mentioned, the total effect is the sum of the direct and indirect effects. For example, the indirect effects (see the bottom section of Figure 9.45) are:
Figure 9.45 shows the BizStats procedure for running an SEM PLS model and the model results. Pay close attention to how the SEM inputs are entered in BizStats in Figure 9.45. Look for the bold letters beside the results to identify where they are along the SEM path model. As mentioned, the total effect is the sum of the direct and indirect effects. For example, the indirect effects (see the bottom section of Figure 9.45) are: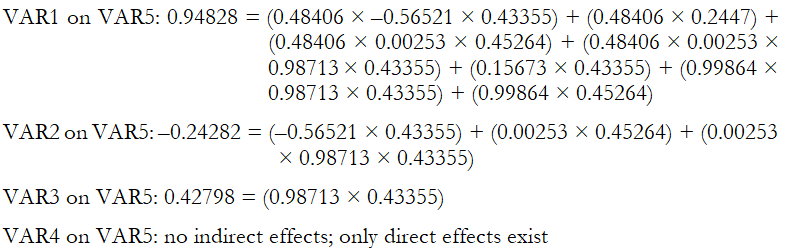
The results indicate that the use of AI technology and trust in said technology has the highest direct impact on whether the technology is accepted and widely used in the organization. However, the organizational structure and culture also have the largest total impact, where the bulk of the impact comes from indirect sources.
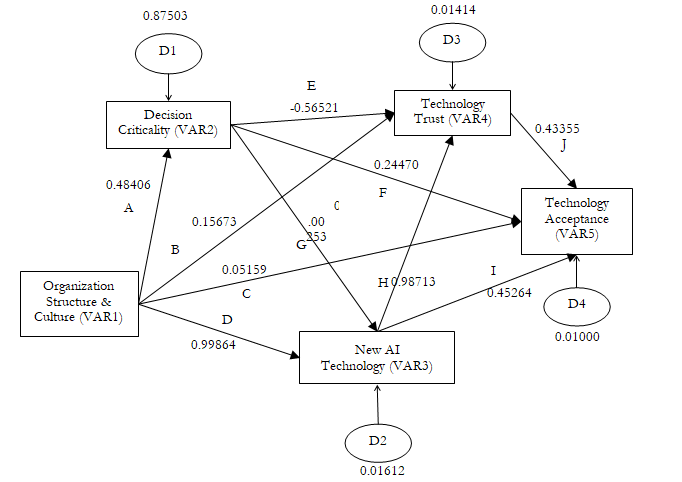
Figure 9.44: Structural Equation Model and Partial Least Squares (Path Estimation)
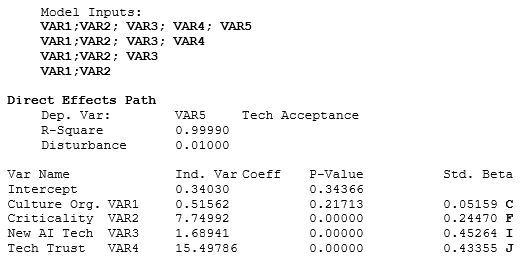
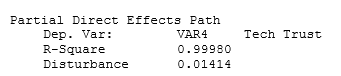
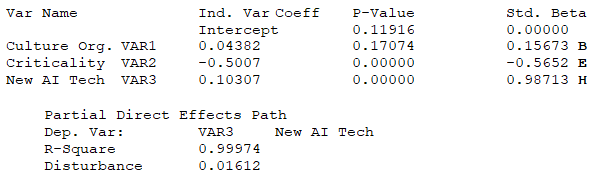
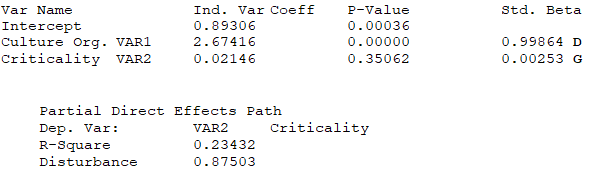
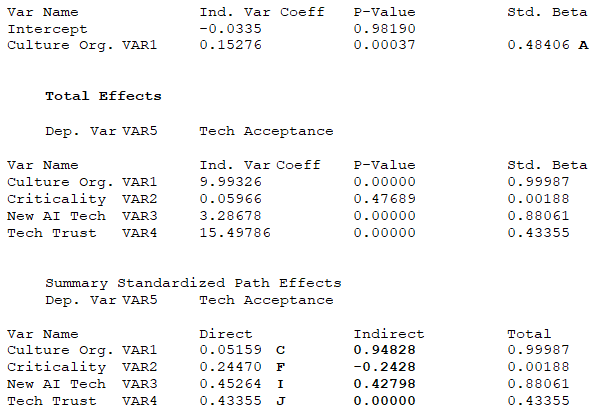
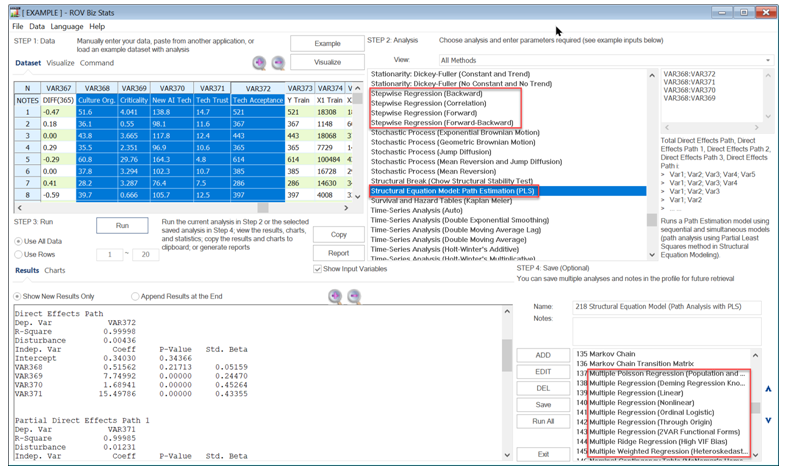
Figure 9.45: SEM PLS Results