Scenario Analysis can be easily performed through a two-step process: set up the model and run the model. In the Scenario Input Settings subtab (Figure 4.2 shows the DCF module’s default example’s Scenario Input Settings), start by selecting the output variable you wish to test from the drop-down list. Then, based on your selection, the precedents of the output will be listed under two categories (Line Item, which will change all input assumptions in the entire line item in the model simultaneously, and Single Item, which will change individual input assumption items). Select one or two checkboxes at a time and the inputs you wish to run scenarios on and enter the plus/minus percentage to test and the number of steps between these two values to test. You can also add color coding of sweet spots or hotspots in the scenario analysis (values falling within different ranges have unique colors). You can create multiple scenarios and Save As each one (enter a Name for each saved scenario).
Proceed to the Scenario Output Tables (Figure 4.3) to run the saved analysis. Click on the drop-down list to select the previously saved scenarios to run. The selected scenario table complete with sweet spot/hotspot color coding will be generated. Decimals can be increased or decreased as required, and you can Copy Grid or View Full Grid as needed. To facilitate review of the scenario tables, pay attention to the NOTE, which provides the information of which input variable is set as the rows versus columns.
Here are some additional tips:
- You can create and run Scenario Analysis on either one or two input variables at once.
- The scenario settings can be saved for retrieval in the future, which means you can modify any input assumptions in the Projects’ models and come back to rerun the saved scenarios.
- You can also increase/decrease decimals in the scenario results tables, as well as change colors in the tables for easier visual interpretation (especially when trying to identify scenario combinations, or so-called sweet spots and hotspots).
- Remember to scroll down the form for additional input variables.
- Line Items can be changed using ±X% where all inputs in the line are changed multiple times within this specific range all at once. Individual Items can be changed ±Y units where each input is changed multiple times within this specific range.
- You can either double-click on a saved model to retrieve its settings or click on the Edit button to edit the settings. Do not forget to click Save to save any changes you made or use Save As to duplicate the model and create a new model with the modified settings.
- Sweetspots and hotspots refer to specific combinations of two input variables that will drive the output up or down. For instance, suppose investments are below a certain threshold and revenues are above a certain barrier, then the NPV will be in excess of the expected budget (the sweetspots, perhaps highlighted in green), or if investments are above a certain value, NPV will turn negative if revenues fall below a certain threshold (the hotspots, perhaps highlighted in red).
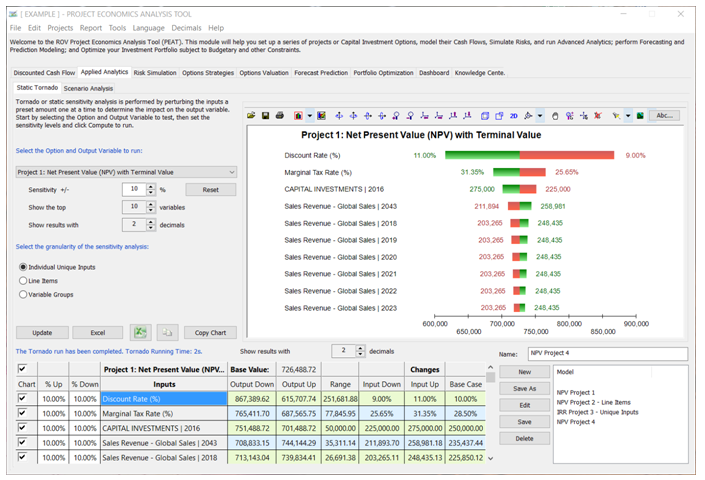
Figure 4.1 – Static Tornado Analysis
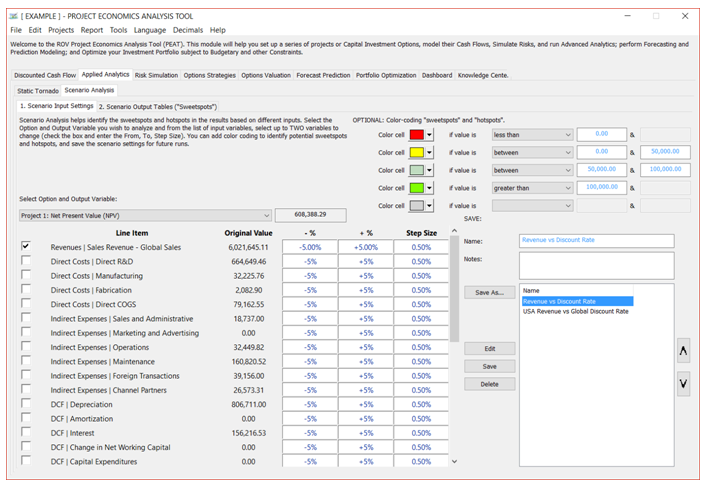
Figure 4.2 – Scenario Analysis: Scenario Input Settings
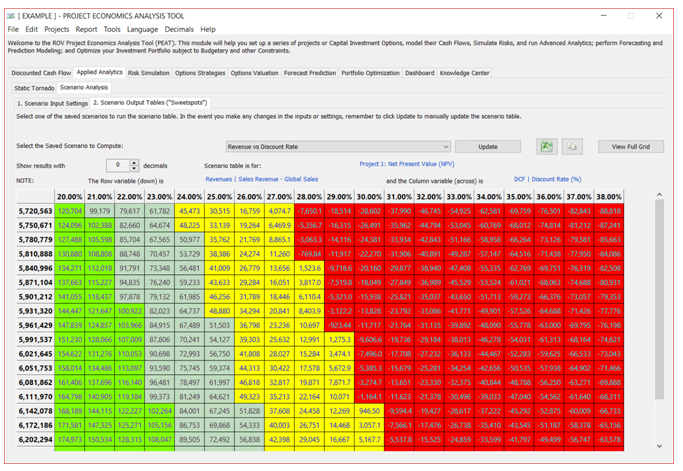
Figure 4.3 – Scenario Analysis: Scenario Output Tables