Theory
Trendlines can be used to determine if a set of time-series data follows any appreciable time-series trend. Trends can be linear or nonlinear (such as exponential, logarithmic, moving average, power, or polynomial curves).
Procedure
- Select the data you wish to analyze, click on Risk Simulator | Forecasting | Trendline. Select the relevant trendlines you wish to apply on the data (e.g., select all methods by default), enter in the number of periods to forecast (e.g., 6 periods), and click OK (Figure 11.26).
- Review the report to determine which of these test trendlines provide the best fit and best forecast for your data.
Notes
Figure 11.27 shows example shapes of the various trendlines, and the technical details of each trendline are noted below. Trendlines can also be used to forecast future periods (Figure 11.28).
- Exponential trendline is useful when data values rise or fall at constantly increasing rates. Exponential trendlines cannot be computed if the dataset contains zero or negative values. The equation for the exponential trendline is
 where b and c are constants and e is the natural exponential or base of the natural log (2.718).
 - Linear trendline is best for fitting straight lines for simple linear The dataset is linear if the pattern in its data points looks like a straight line. A linear trendline usually shows that something is increasing or decreasing at a steady rate. The equation for the line is
 where a and b are constants.
 - Logarithmic trendline is useful when the rate of change in the data increases or decreases quickly and then levels out. A logarithmic trendline requires positive values. Examples include population growth of animals or bacteria in a fixed-space area, where the population hits a maximum sustainable level as space and resources decrease and competition increases with the increase in population. The equation for the line is
 where a and b are constants.
 - Moving Average trendline evens out fluctuations in the dataset to show a pattern or trend. A moving average uses a set number of data points and averages them, then uses the average as a point in the line. For example, if Period is set to 2, the average of the first two data points is used as the first point in the moving average trendline. The average of the second and third data points is used as the second point in the trendline, and so on. The points move, and the averaging number of period remains the same, hence the term moving average.
- Polynomial or curvilinear trendline is useful when your data fluctuates such as when analyzing gains and losses over a large dataset over time. The power or order of the polynomial can be determined by the number of fluctuations in the data or by how many bends (hills and valleys) appear in the curve. For example, an Order 2 polynomial has only one hill or valley, an Order 3 has one or two hills or valleys, and an Order 4 has up to three hills or valleys. The equation for the n-order polynomial line is
 where a and b are constants.
 - Power trendline is useful for datasets that compare measurements that increase at a specific rate, for example, the acceleration of a race car at some fixed time intervals. Power trendlines cannot be computed if the data contain zero or negative values. The equation for the power trendline is
 where b and c are constants.
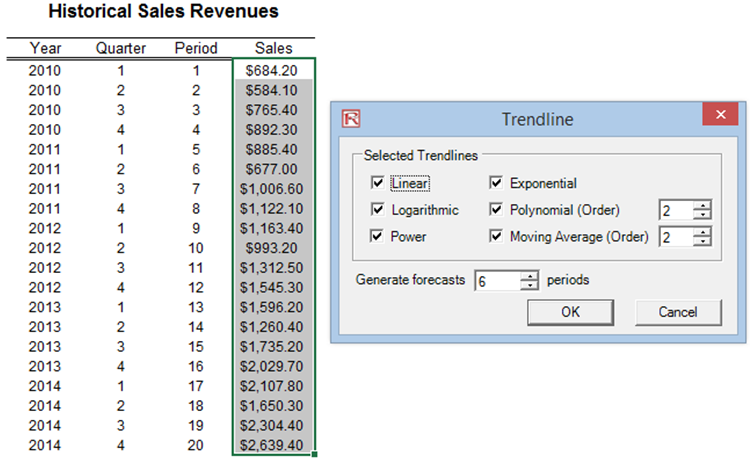
Figure 11.26: Trendline Methods
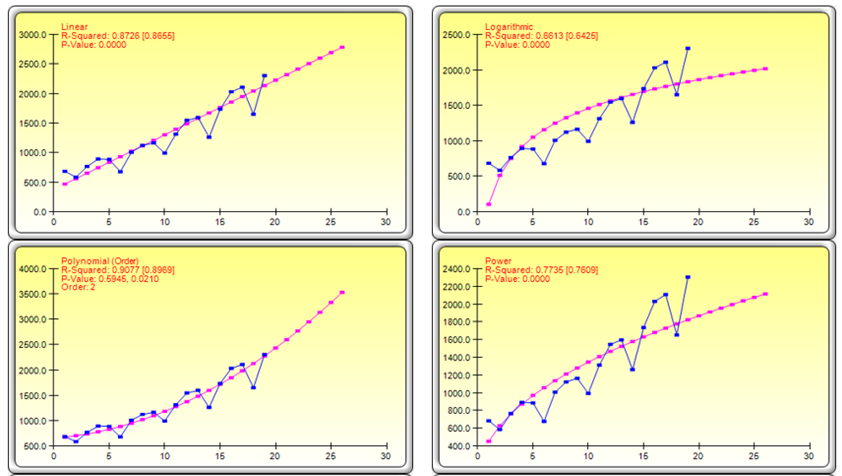
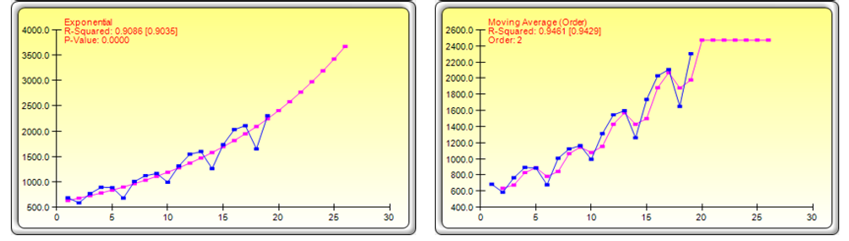
Figure 11.27: Trendline Charts and Results
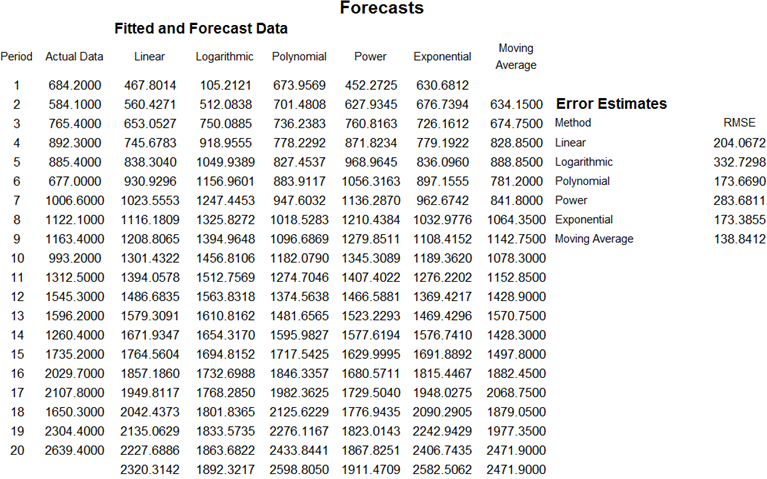

Figure 11.28: Trendline Backfit and Forecast Fit