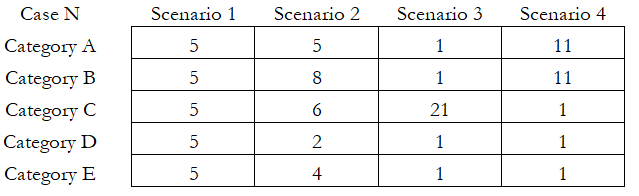
Another issue with regard to data reliability and consistency pertains to the randomized and stratified sampling that is performed. For instance, we may get a high level of data consistency and reliability but if the people sampled are from the same group or category, then the data may not be entirely reliable. As an example, suppose we wish to survey voter sentiment on a particular issue in a state. If all the voters selected were Democrats or predominantly Republicans, then the data might be skewed one way. Hence, to test for the diversity of a randomized and stratified sampling group, we can apply the Shannon, Brillouin, and Simpson model. In Case N in the accompanying table, suppose we have five categories of self-described voters (highly conservative, conservative, moderate, liberal, and highly liberal), and the data grid shows the number of people sampled within each category.
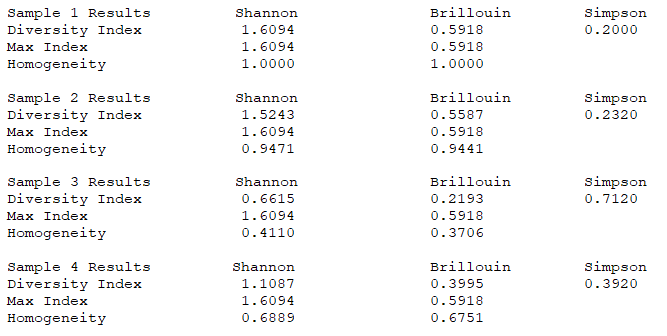
The following shows the results of the four samples. The higher the diversity index is to the maximum index, the higher the level of diversity. Clearly, we see that Scenario 1 has the highest homogeneity score, and the diversity index is closest to the maximum index value. Scenario 2 has a 94.71% homogeneity score, while Scenarios 3 and 4 have the lowest diversity index relative to the maximum value.