- Related AI/ML Methods: Regression Trees CART, Gaussian Mix, Support Vector Machines
- Related Traditional Methods: Linear Discriminant Analysis, Logistic Regression (Logit)
A Linear Discriminant Analysis (LDA) approach classifies a categorical dependent Training Y variable using one or more characteristic Training X variables (Figure 9.72). This supervised method applies maximum linear discriminant ratios (i.e., the ratio of between-class variance to within-class variance), which allows a clear separation or groupings of the Testing X variable. In other words, the separations are obtained through the maximization of ![]() or the sum of squares ratio of a linear combination
or the sum of squares ratio of a linear combination ![]() The optimized coefficient results help identify how each of the independent variables contributes towards the categorization. The group assignment will be based on the maximum estimated impact scores. To run the model, enter the variables you need to classify and enter the number of clusters desired. For instance, the required model inputs look like the following:
The optimized coefficient results help identify how each of the independent variables contributes towards the categorization. The group assignment will be based on the maximum estimated impact scores. To run the model, enter the variables you need to classify and enter the number of clusters desired. For instance, the required model inputs look like the following:
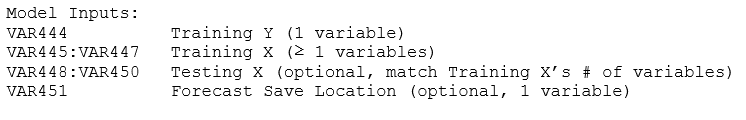
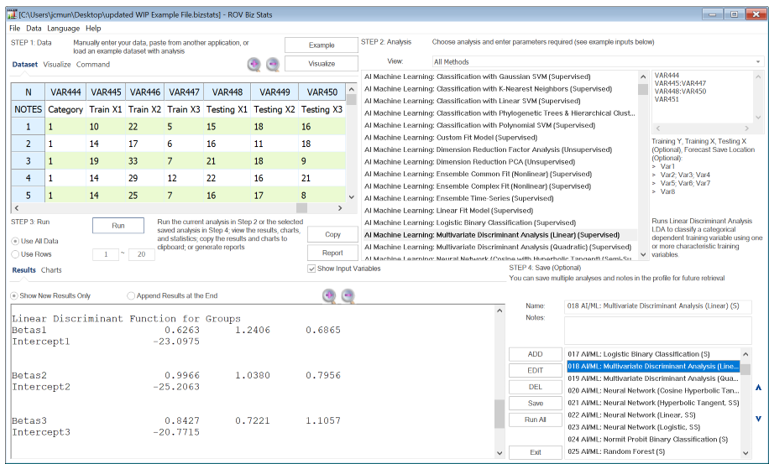
Figure 9.72: AI/ML Linear Discriminant Analysis
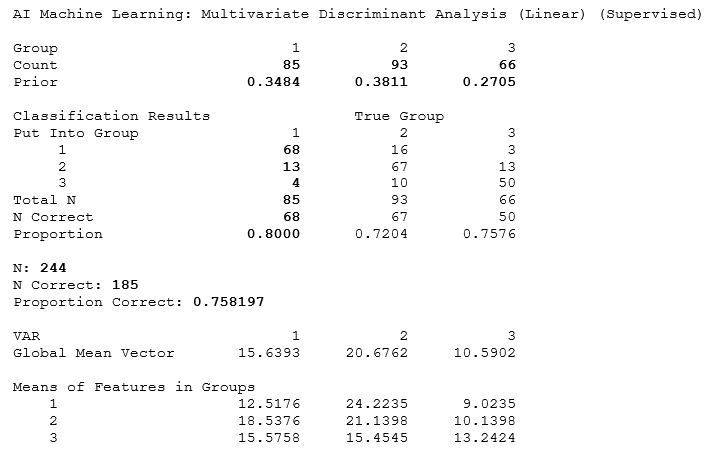
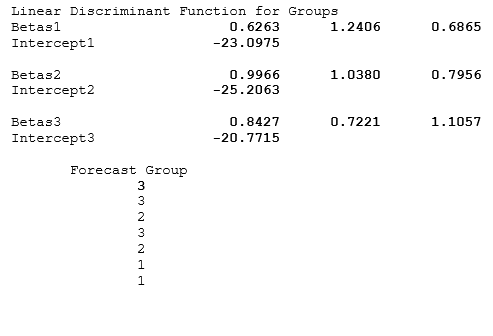
The results are self-explanatory in that the group counts are provided, as well as the model’s classification (“Put Into Group”) compared to the actual group (“True Group”) or the training dataset’s dependent variable. For instance, we see in the original data of 244 rows (N = 244 or 85 + 93 + 66), that 34.84% were in category 1, 38.11% in category 2, and 27.05% in category 3. Out of the 85 originally in category 1 from the training dataset, the model selected 68 of these into group 1, 13 into group 2, and 4 into group 3, which means there is an 80% accuracy (68/85). In total, there were 185 correctly grouped values out of 244, providing a 75.82% accuracy. The groups’ means are also shown, as are the estimated coefficients for the three groups. Recall that LDA uses a linear discriminant model to maximize the sums of squares ratio, and we can use these coefficients in the same manner. For example, suppose the first row for the testing dataset (Figure 9.72) has the following: 15, 18, 16. We can then apply the three groups’ coefficients and select the one with the highest discriminant value.
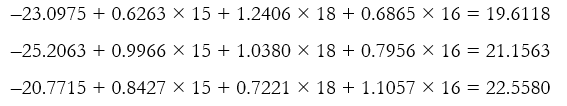
Therefore, this first line item belongs to group 3. All other rows of testing data are computed in a similar fashion and categorized appropriately.