Outliers, as discussed, will impact the validity and consistency of your data. The Grubbs test for outliers is used to test the null hypothesis that all the values are from the same normal population without any outliers. In other words, if we fail to reject the null hypothesis, we can safely state that there are no outliers. To illustrate, suppose we have the two variables below, each with 11 data points. Notice that VAR1 has a clear outlier (bold value, 3).
VAR1: 145, 125, 190, 135, 220, 130, 210, 3, 165, 165, 150
VAR2: 145, 125, 190, 135, 220, 130, 210, 203, 165, 165, 150
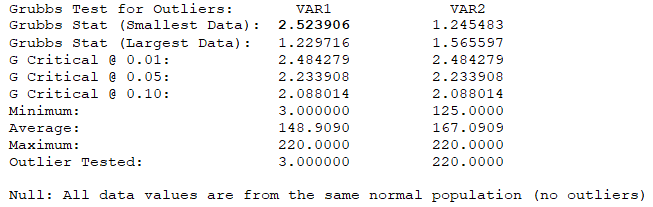
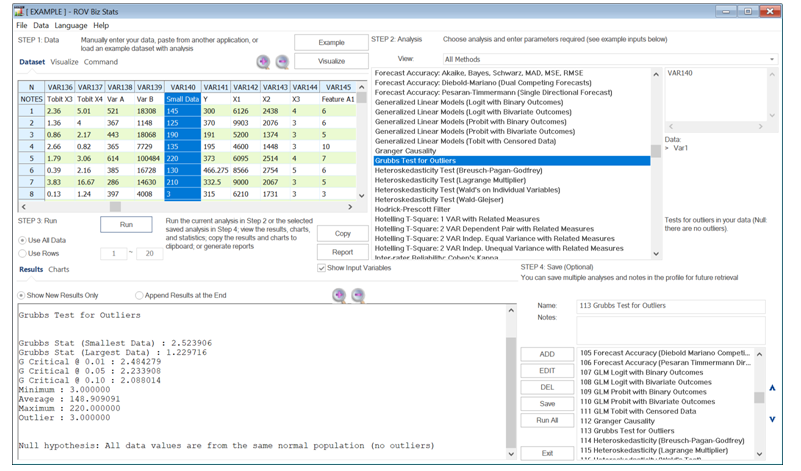
When we run Grubb’s test in BizStats, the results are shown below. We see that for VAR1, the Grubbs statistic for the smallest data point (i.e., 3) exceeds the critical values of all three alpha significance values, indicating that we can reject the null hypothesis and conclude that the value 3 is, indeed, a statistical outlier. In contrast, VAR2’s results indicate a Grubbs statistic under the critical limits, which means we cannot reject the null hypothesis and we have to conclude that the data does not have any statistical outliers.
A related test is the Mahalanobis Distance, which measures the distance between point X and a distribution Y, based on multidimensional generalizations of the number of standard deviations X is away from the average of Y. This multidimensional Mahalanobis distance is equivalent to standard Euclidean distance. The null hypothesis tested is that there are no outliers in each of the data rows.