File Name: Project Management – Cost Estimation Model
Location: Modeling Toolkit | Project Management | Cost Estimation Model
Brief Description: Illustrates how to use Risk Simulator for running a Monte Carlo simulation on a multi-phased project to forecast costs and cost overruns, simulating discrete events (success/failure and go/no-go outcomes), linking these events, and linking the input parameters in a simulation assumption to calculated cells
Requirements: Modeling Toolkit, Risk Simulator
This is a cost estimation model used to forecast the potential cost and cost overruns of a multi-phased project, using simulation, where the later phases of the project will depend on the earlier phases. That is, you cannot proceed to the second phase unless the first phase is successful and so forth.
In this example, the model estimates the total cost of a project with five phases, where at each phase, there might be several subphases. For each phase or subphase, the minimum, maximum, and most likely estimates of costs are obtained and simulated (Figure 117.1). These cost estimates depend on the forecasts of weeks required in each phase and the cost per week. These costs are simulated through parameter linking to Triangular distributions. For instance, the cells in column G are distributional assumptions linked to columns H, I, and J. In addition, the estimates of minimum, likely, and maximum costs in these columns depend on the estimates of time to completion and cost per week in columns L to O. Cost overruns in each phase and their chances are also simulated in column P. A probability of success is estimated based on past experience and subject matter expert estimates, listed in column Q. Using these projections of project success/failure, Bernoulli distributions are set up in column R to simulate the discrete event of a success (1) or failure (0). We then link these events in column S where only if the previous period is successful will the current phase continue assuming that it too is successful. Otherwise, if the previous phase was a failure, all future phases are canceled and the project stops at that point. Finally, the values in column K are the expected values after accounting for the simulated results of time to completion, cost per week, overrun estimates, and success or failure of each phase.
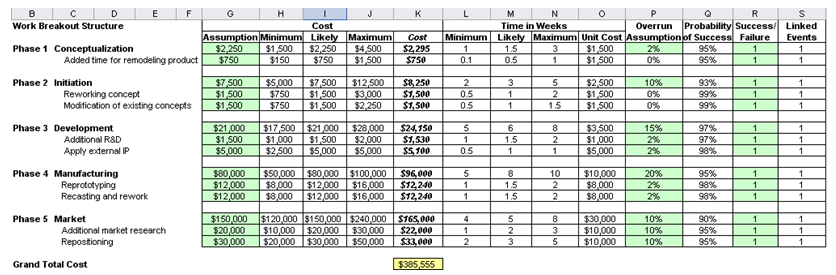
Figure 117.1: Cost estimation of a multi-phased project
Procedure
To run the model, simply:
- Go to the Model worksheet and click on Risk Simulator | Change Profile and select the Cost Estimation Model profile.
- Run the simulation by clicking on Risk Simulator | Run Simulation.
The forecast chart (Figure 117.2) results show a trimodal distribution (a distribution with three peaks) because of the discrete event simulation we ran (i.e., the success and failure probabilities). The right-tail probability past the single-point estimate is found to be 44.50%. This means that there is a 44.50% probability that the expected total cost of this project of $385,555 is not going to be enough (click on Right-Tail and enter 385555 then hit TAB on the keyboard). Therefore, to be 95% certain there are adequate funds to cover the cost of the project, you need $457,006 (click on Left-Tail and enter 95 in the Certainty box, then hit TAB on the keyboard).
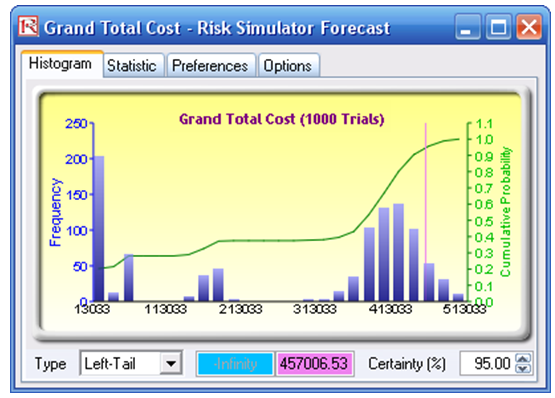
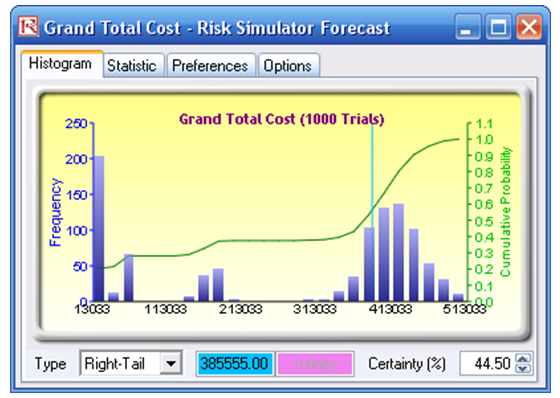
Figure 117.2: Simulated cost outputs