File Name: Yield Curve – CIR Model
Location: Modeling Toolkit | Yield Curve | CIR Model
Brief Description: Estimates and models the term structure of interest rates and yield curve approximation assuming the interest rates are mean-reverting
Requirements: Modeling Toolkit, Risk Simulator
Modeling Toolkit Function Used: MTCIRBondYield
The yield curve is the time-series relationship between interest rates and the time to maturity of some underlying debt. The more formal mathematical description of this relationship is called the term structure of interest rates. The yield curve can take on various shapes. In the normal yield curve, yields rise as maturity lengthens and the yield curve is positively sloped, reflecting investor expectations for the economy to grow in the future (and hence an expectation that inflation rates will rise in the future). An inverted yield curve occurs when long-term yields fall below short-term yields, and long-term investors will settle for lower yields now if they think the economy will slow or even decline in the future. This situation is indicative of a worsening economy in the future (and hence an expectation that inflation will remain low in the future). Another potential situation is a flat yield curve, signaling uncertainty in the economy. The yield curve also can be humped or show a smile or a frown. The yield curve over time can change in shape through a twist or bend, a parallel shift, or a movement on one end versus another.
As the yield curve is related to inflation rates, and central banks in most countries have the ability to control monetary policy to target inflation rates, inflation rates are mean-reverting in nature. This also implies that interest rates are mean-reverting as well as stochastically changing over time.
This chapter shows the Cox-Ingersoll-Ross (CIR) model, which is used to compute the term structure of interest rates and the yield curve. The CIR model assumes a mean-reverting stochastic interest rate. The rate of reversion and long-run mean rates can be determined using Risk Simulator’s Statistical Analysis tool. If the long-run rate is higher than the current short rate, the yield curve is upward sloping, and vice versa. Please see Figure 163.1.
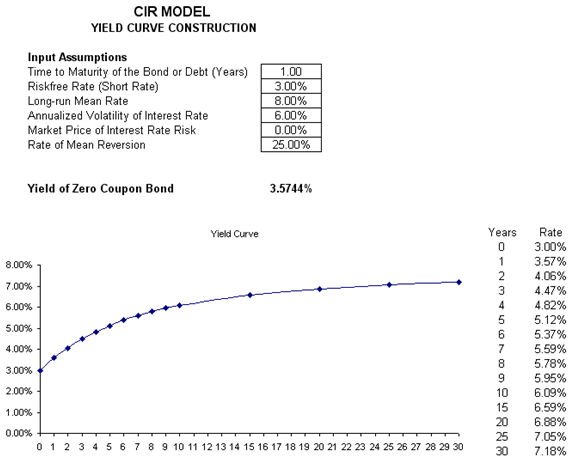
Figure 163.1: CIR model on yield curve construction